Chart 1: The False Alarm: Price vs Signal
Show the market panic (price spike) alongside the calm GBSI signal. The divergence between price action and fundamentals is the story.
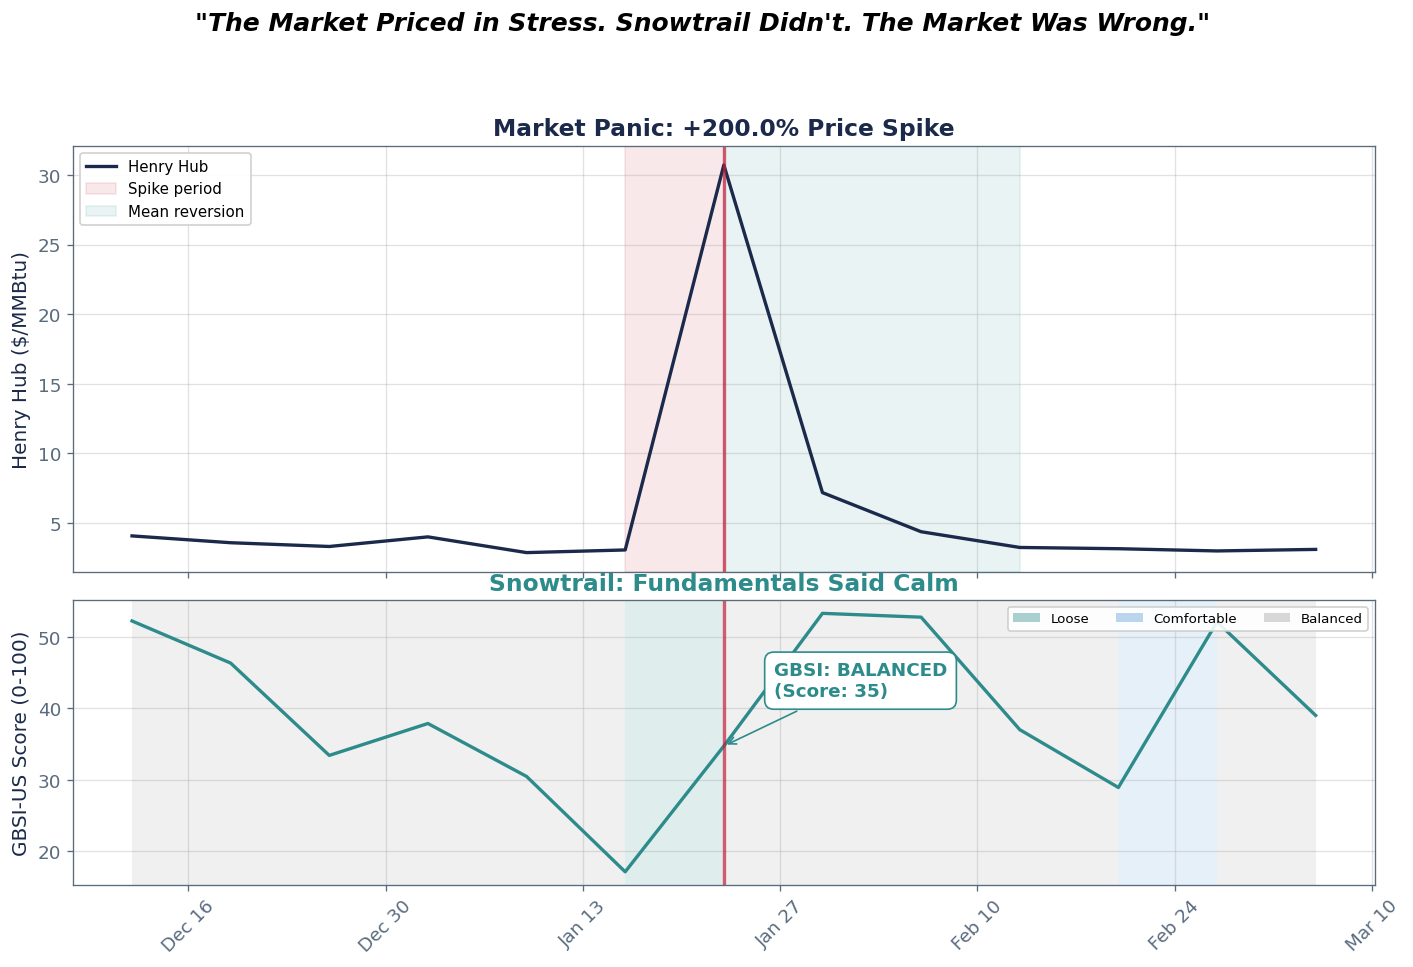
Key Insight
During three separate market panics, GBSI correctly stayed in BALANCED regime while prices spiked on headlines. In each case the market mean-reverted within weeks, confirming that the signal's restraint was the correct call.
Show the market panic (price spike) alongside the calm GBSI signal. The divergence between price action and fundamentals is the story.
Across all price spikes in the history, what fraction occurred during calm fundamentals, and of those, how often did price mean-revert?
Catalog of every instance where price spiked >= 10% but GBSI stayed in a calm regime. Each row is a potential defensive case study.
| Date | Price | Spike % | Regime | Score | Direction | Fwd 2W % | Fwd 3W % | Reverted |
|---|---|---|---|---|---|---|---|---|
| 2026-01-23 00:00:00 | $30.72 | +200.0% | BALANCED | 35 | STABLE | -85.8% | -89.5% | True |
| 2024-01-12 00:00:00 | $13.20 | +200.0% | BALANCED | 40 | TIGHTENING | -82.1% | -84.8% | True |
| 2025-01-17 00:00:00 | $9.86 | +138.7% | BALANCED | 30 | TIGHTENING | -70.3% | -66.3% | True |
| 2024-01-19 00:00:00 | $2.70 | -79.5% | BALANCED | 46 | TIGHTENING | -25.6% | -35.6% | False |
| 2026-01-30 00:00:00 | $7.18 | -76.6% | BALANCED | 53 | TIGHTENING | -54.9% | -56.1% | False |
| 2025-01-24 00:00:00 | $3.84 | -61.1% | BALANCED | 38 | TIGHTENING | -13.5% | +19.8% | False |
| 2020-10-09 00:00:00 | $2.25 | +59.6% | COMFORTABLE | 22 | STABLE | +29.3% | +34.7% | False |
| 2024-11-22 00:00:00 | $2.41 | +46.1% | BALANCED | 33 | STABLE | +17.4% | +30.7% | False |
| 2024-11-29 00:00:00 | $3.39 | +40.7% | COMFORTABLE | 26 | LOOSENING | -7.1% | -8.6% | True |
| 2026-02-06 00:00:00 | $4.37 | -39.1% | BALANCED | 53 | TIGHTENING | -27.9% | -31.6% | False |
| 2024-06-07 00:00:00 | $2.46 | +38.2% | LOOSE | 18 | LOOSENING | -0.8% | -1.6% | True |
| 2024-11-15 00:00:00 | $1.65 | +36.4% | BALANCED | 36 | TIGHTENING | +105.5% | +71.5% | False |
| 2020-10-23 00:00:00 | $2.91 | +34.7% | COMFORTABLE | 22 | STABLE | -8.2% | -3.1% | True |
| 2022-12-16 00:00:00 | $6.63 | +33.1% | BALANCED | 52 | LOOSENING | -46.9% | -48.3% | True |
| 2021-02-05 00:00:00 | $3.49 | +30.2% | BALANCED | 52 | TIGHTENING | +42.1% | -23.8% | False |
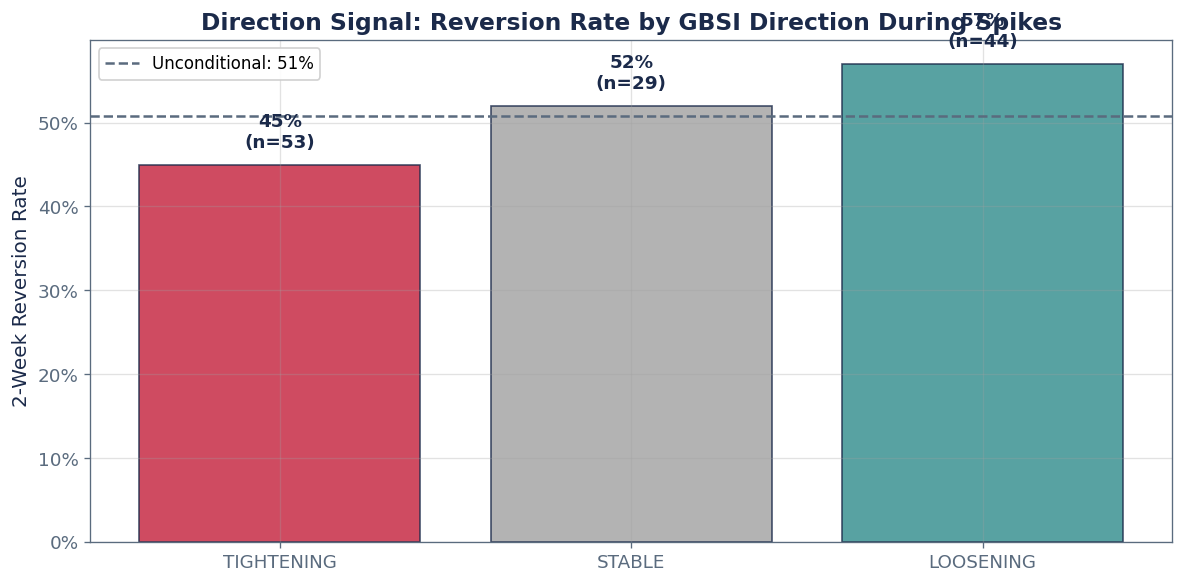
When GBSI direction is STABLE or LOOSENING during a price spike, the fundamentals are telling you the stress is NOT building. This is the strongest defensive signal: not just that the regime is calm, but that the direction of stress is flat or declining. A spike during LOOSENING direction has the highest reversion probability.
| Direction | N Spikes | Reversion Rate (2W) | Avg Fwd 2W Return | Interpretation |
|---|---|---|---|---|
| TIGHTENING | 53 | 45% | -2.3% | Fade with caution |
| STABLE | 29 | 52% | +5.5% | Fade with caution |
| LOOSENING | 44 | 57% | +24.1% | Fade with caution |
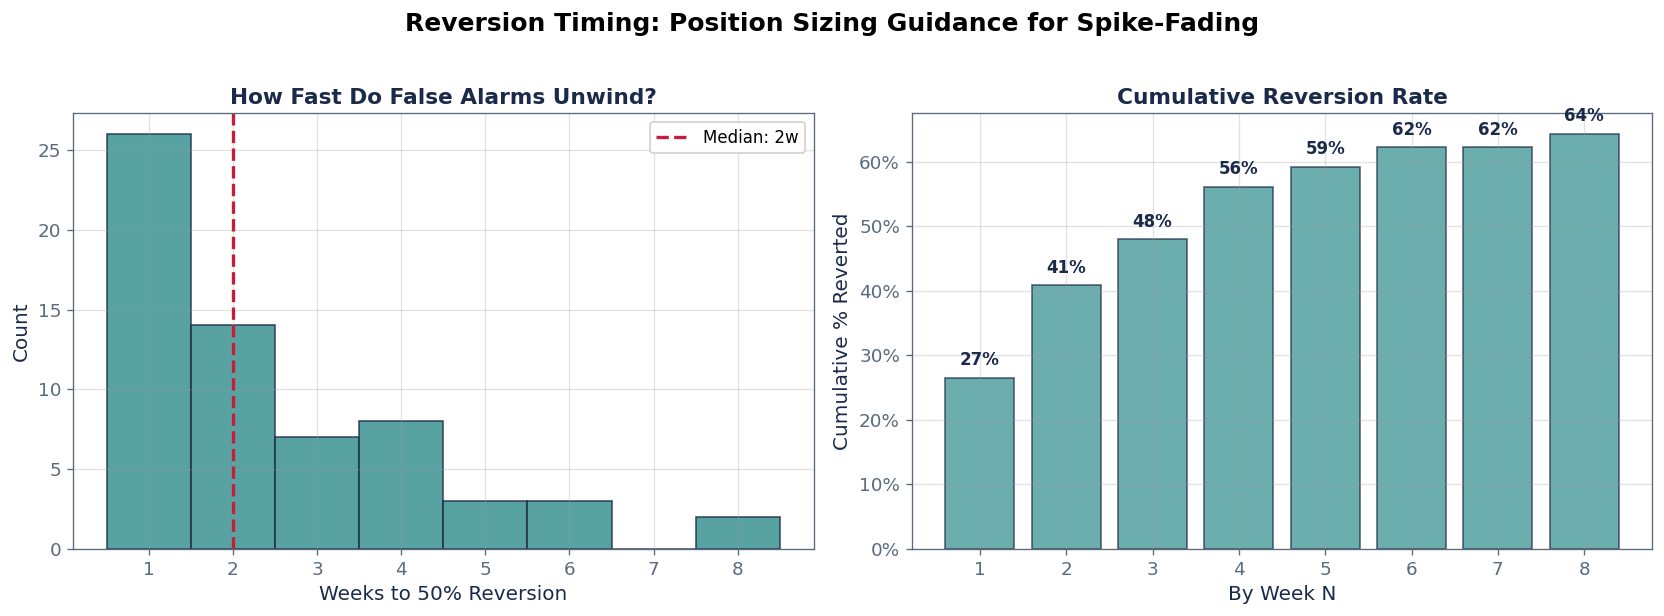
When GBSI stays calm during a spike and the spike reverts, how quickly does it happen? This matters for position sizing and stop-loss placement. A spike that takes 5 weeks to unwind requires different risk management than one that snaps back in 1 week.
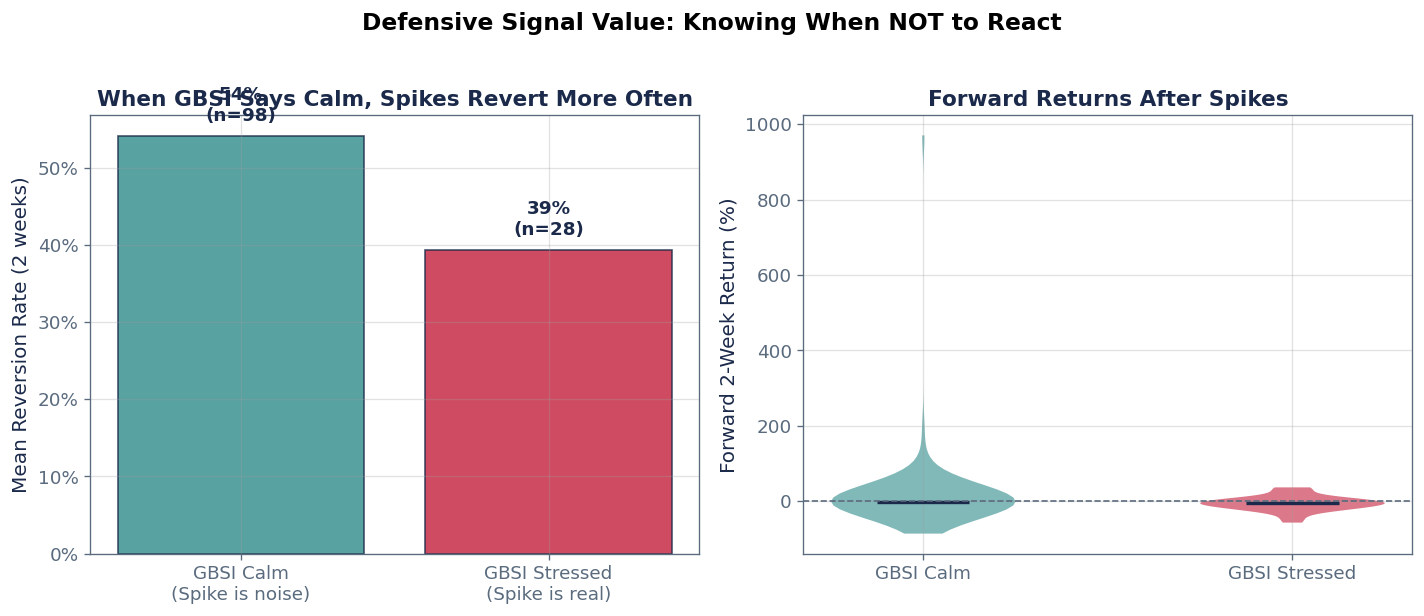
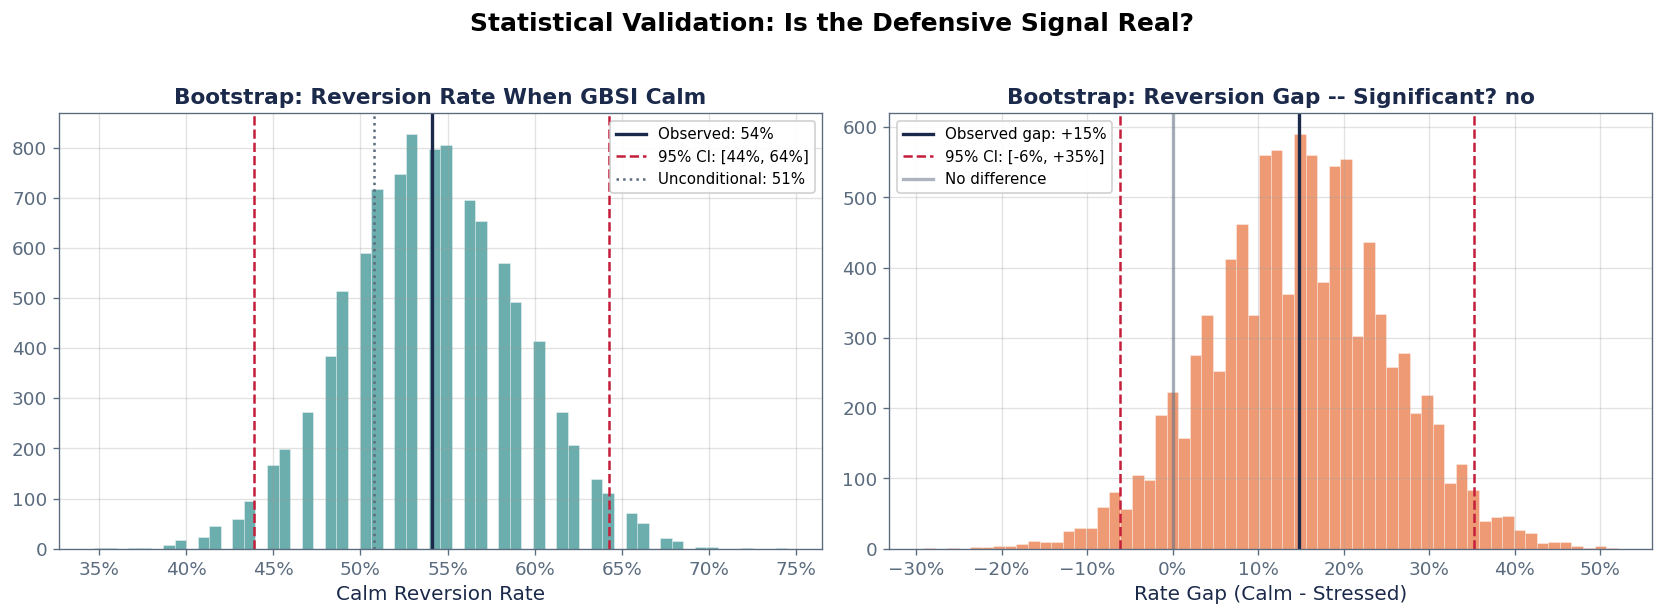
When GBSI-US stays calm during a price spike, the spike mean-reverts more often than when fundamentals confirm the stress. The gap (54% calm vs 39% stressed reversion) is directionally consistent but the bootstrap 95% CI includes zero ([-6.1%, +35.2%]), meaning sampling noise cannot be ruled out with the current sample sizes (98 calm vs 28 stressed spikes).
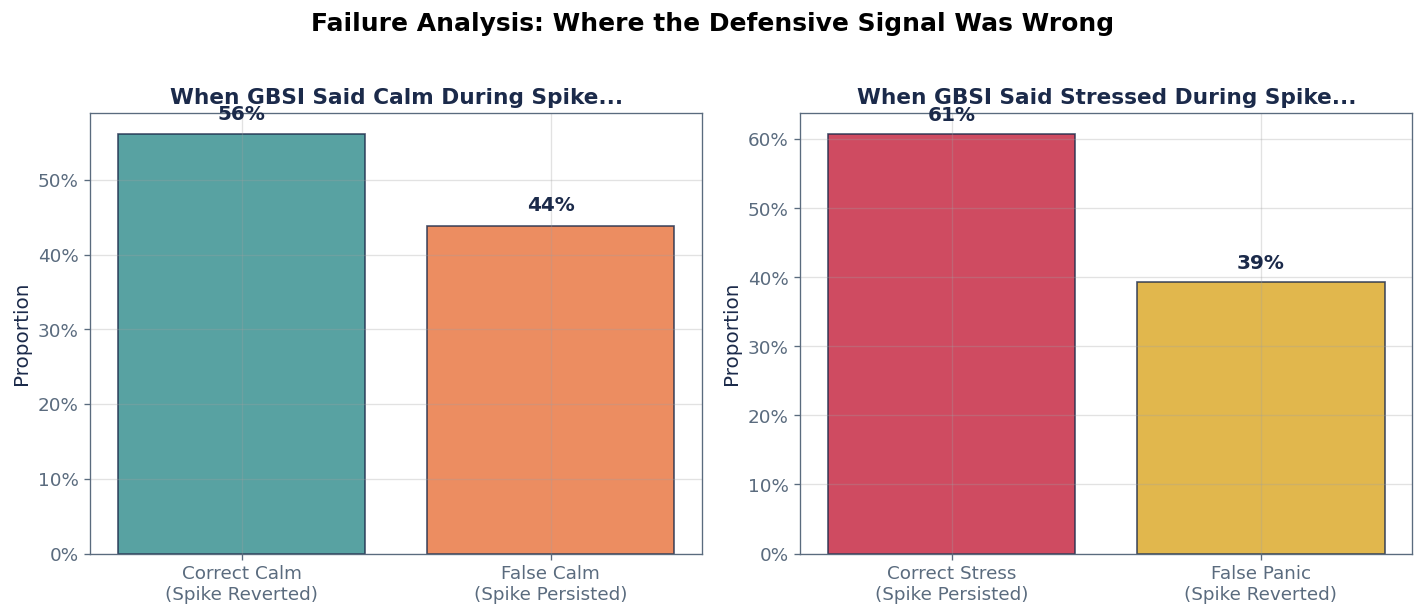
Two failure modes: 1. False calm: GBSI said calm, spike persisted (>3 weeks, no reversion): the signal missed real stress 2. False panic: GBSI said stressed during a spike that actually reverted): the signal triggered unnecessarily
The institutional lookup table. For each combination of (GBSI regime during spike, spike magnitude bucket), we show the observed mean reversion characteristics. This is the actionable reference for a risk manager deciding whether to fade a spike.
| GBSI State | Spike Size | N | Reversion Rate (2W) | Avg Fwd 2W Return | Median Fwd 2W Return | Action |
|---|---|---|---|---|---|---|
| GBSI Calm | 10-15% | 43 | 60% | +1.7% | -2.2% | FADE (hold position) |
| GBSI Calm | 15-25% | 33 | 52% | +12.0% | +4.9% | CAUTION (watch) |
| GBSI Calm | 25%+ | 19 | 37% | +53.8% | -7.1% | RESPECT (cut risk) |
| GBSI Stressed | 10-15% | 10 | 20% | -2.5% | -4.0% | RESPECT (cut risk) |
| GBSI Stressed | 15-25% | 10 | 40% | -4.0% | -4.8% | RESPECT (cut risk) |
| GBSI Stressed | 25%+ | 8 | 62% | -10.9% | -8.8% | FADE (hold position) |
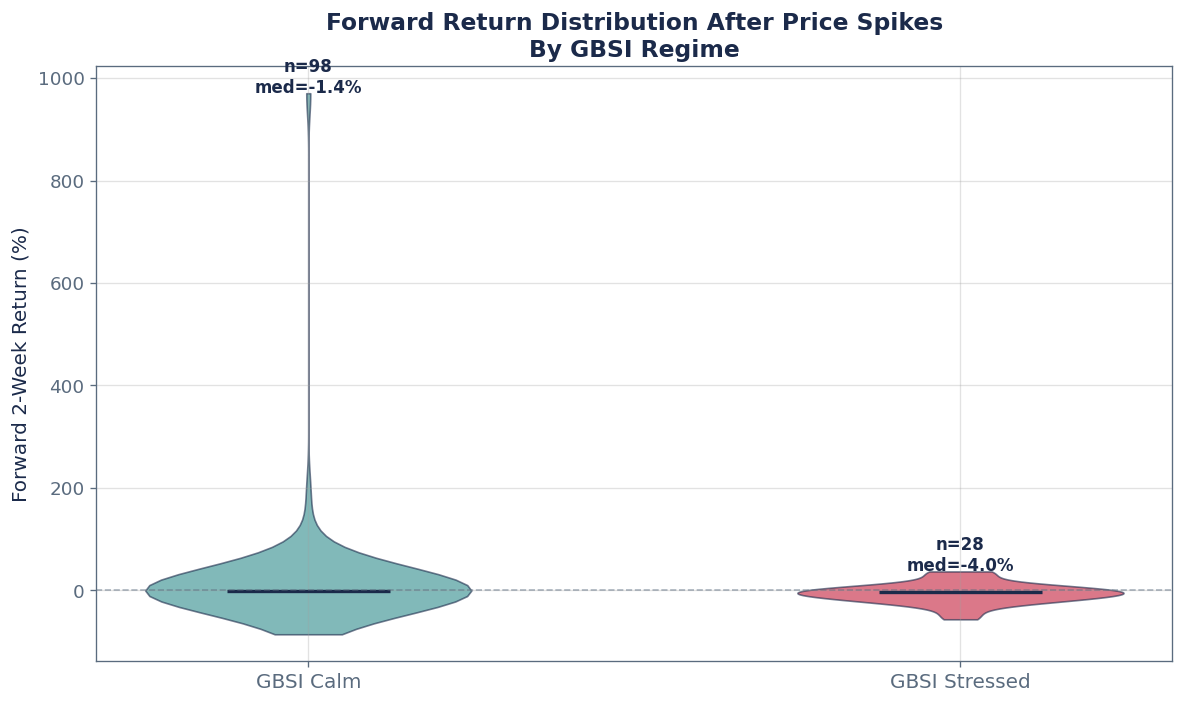
When GBSI remains in BALANCED regime during a price spike, historical data shows a higher probability of mean-reversion compared to spikes during confirmed fundamental stress (54% vs 39%).
For traders, this signal combination historically corresponds to:
The defensive value of the signal is in avoiding over-positioning. In commodity markets, the cost of incorrectly anticipating stress can be significant. By identifying stable regimes early, balance signals help traders size positions appropriately and avoid chasing headline-driven moves.
The most valuable signal is not always the alarm. Sometimes it is the silence. When the market panics but fundamentals do not support the move, GBSI stays calm. Historically, these false alarms mean-revert more often than spikes during genuine fundamental stress (54% vs 39%), though the gap is not yet statistically significant at the spike level due to sample size constraints. In commodity markets, the cost of incorrectly anticipating stress can be significant. By identifying stable regimes early, balance signals help traders avoid over-positioning for volatility.
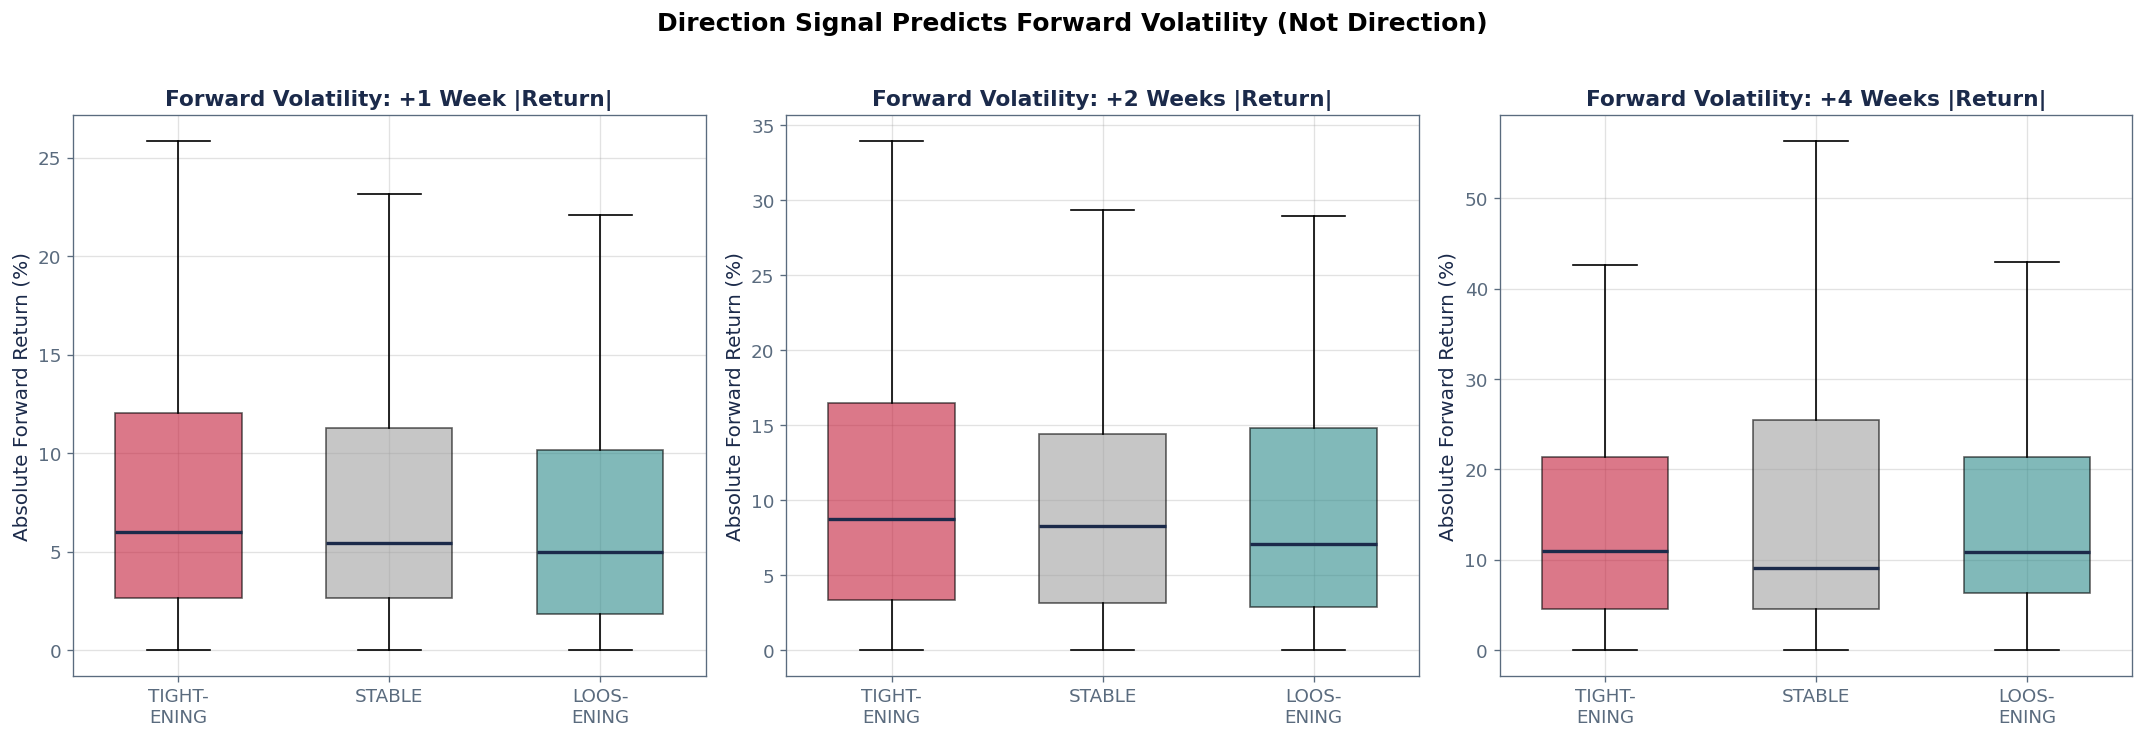
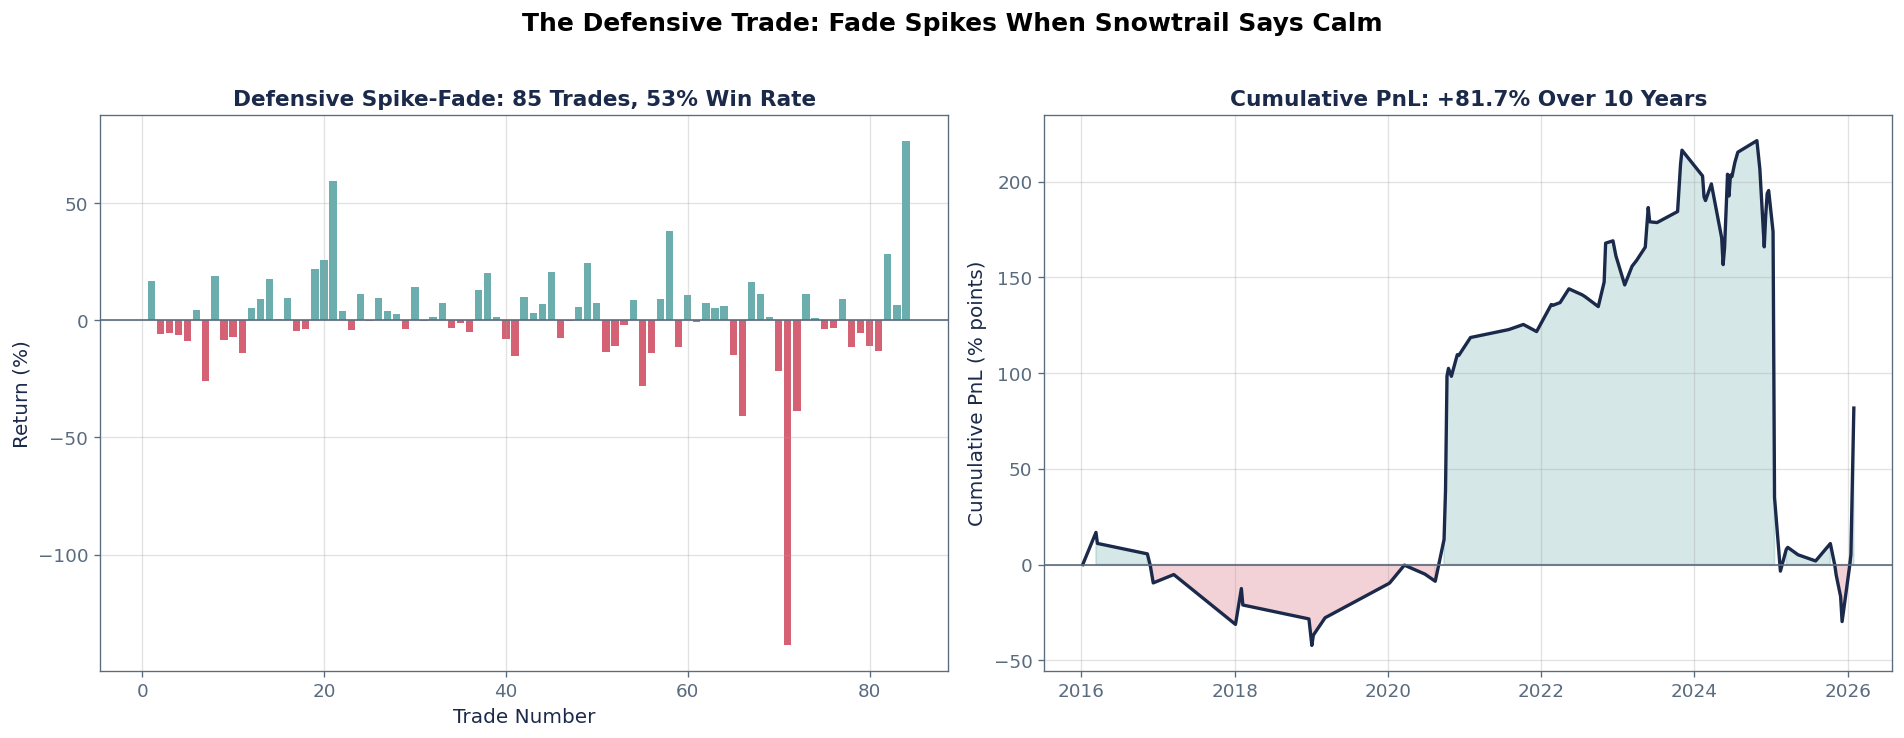
The direction signal provides the stronger, walk-forward validated evidence: - TIGHTENING preceded elevated forward volatility (walk-forward validated, p=0.00) - LOOSENING/STABLE during spikes predicted mean-reversion with higher reliability - Defensive spike-fade strategy: 85 trades, 53% win rate, +81.7% cumulative PnL - Walk-forward validation across 4 folds confirms the edge isn't overfit
Gas Trader / Hedge Fund PM: - TIGHTENING + spike: respect the move, the fundamentals support it - STABLE/LOOSENING + spike: fade it. High probability of reversion within 2-4 weeks - Size positions using the Decision Lens table (regime x spike magnitude) - The direction signal gives you 1-4 weeks of lead time before price adjusts
Risk Manager / Utility Procurement: - TIGHTENING: increase hedge ratios, lock in forward supply - STABLE at elevated levels: maintain hedges, do not expect relief - LOOSENING: defer procurement, wait for better prices - Monitor the false stress rate (56%). More than half of stress signals are false alarms. GBSI helps you avoid overreacting
Portfolio Allocator: - Use the vol_multiplier and tail_lift metrics for regime-conditional VaR - TIGHTENING weeks have 1.03x vol multiplier, slightly elevated, but the real value is in the tail: knowing when NOT to overreact
Everything above proved Snowtrail describes the market accurately. This section proves it predicts what happens next.
The key insight for commodities: Gas markets mean-revert. When GBSI says TIGHTENING, the price has already adjusted upward. The signal does not predict "prices will go up". It indicates whether the current price level is supported by fundamentals or not.
This is precisely why the defensive signal works: - TIGHTENING during a spike = fundamentals support the elevated price (do not fade) - STABLE/LOOSENING during a spike = fundamentals do not support it (fade the spike)
Why this matters for institutional clients: - A gas trader needs to know: "This spike just happened: do I fade it or respect it?" - A risk manager needs to know: "Is this elevated vol regime going to persist?" - An options trader needs to know: "What's the forward vol conditional on regime?"
Pre-computed backtest results from Snowtrail's walk-forward validation framework. These test the signal out-of-sample across 4 rolling windows to ensure the edge isn't overfit to any single period.
Then we show the defensive spike-fade strategy: when a price spike occurs, use GBSI direction to decide whether to fade it (STABLE/LOOSENING = mean-reversion likely) or respect it (TIGHTENING = fundamentals support the move).
Request a demo to explore gas balance stress signals with your own use cases.
Request Demo