Summary & Key Takeaways
The Story in One Sentence
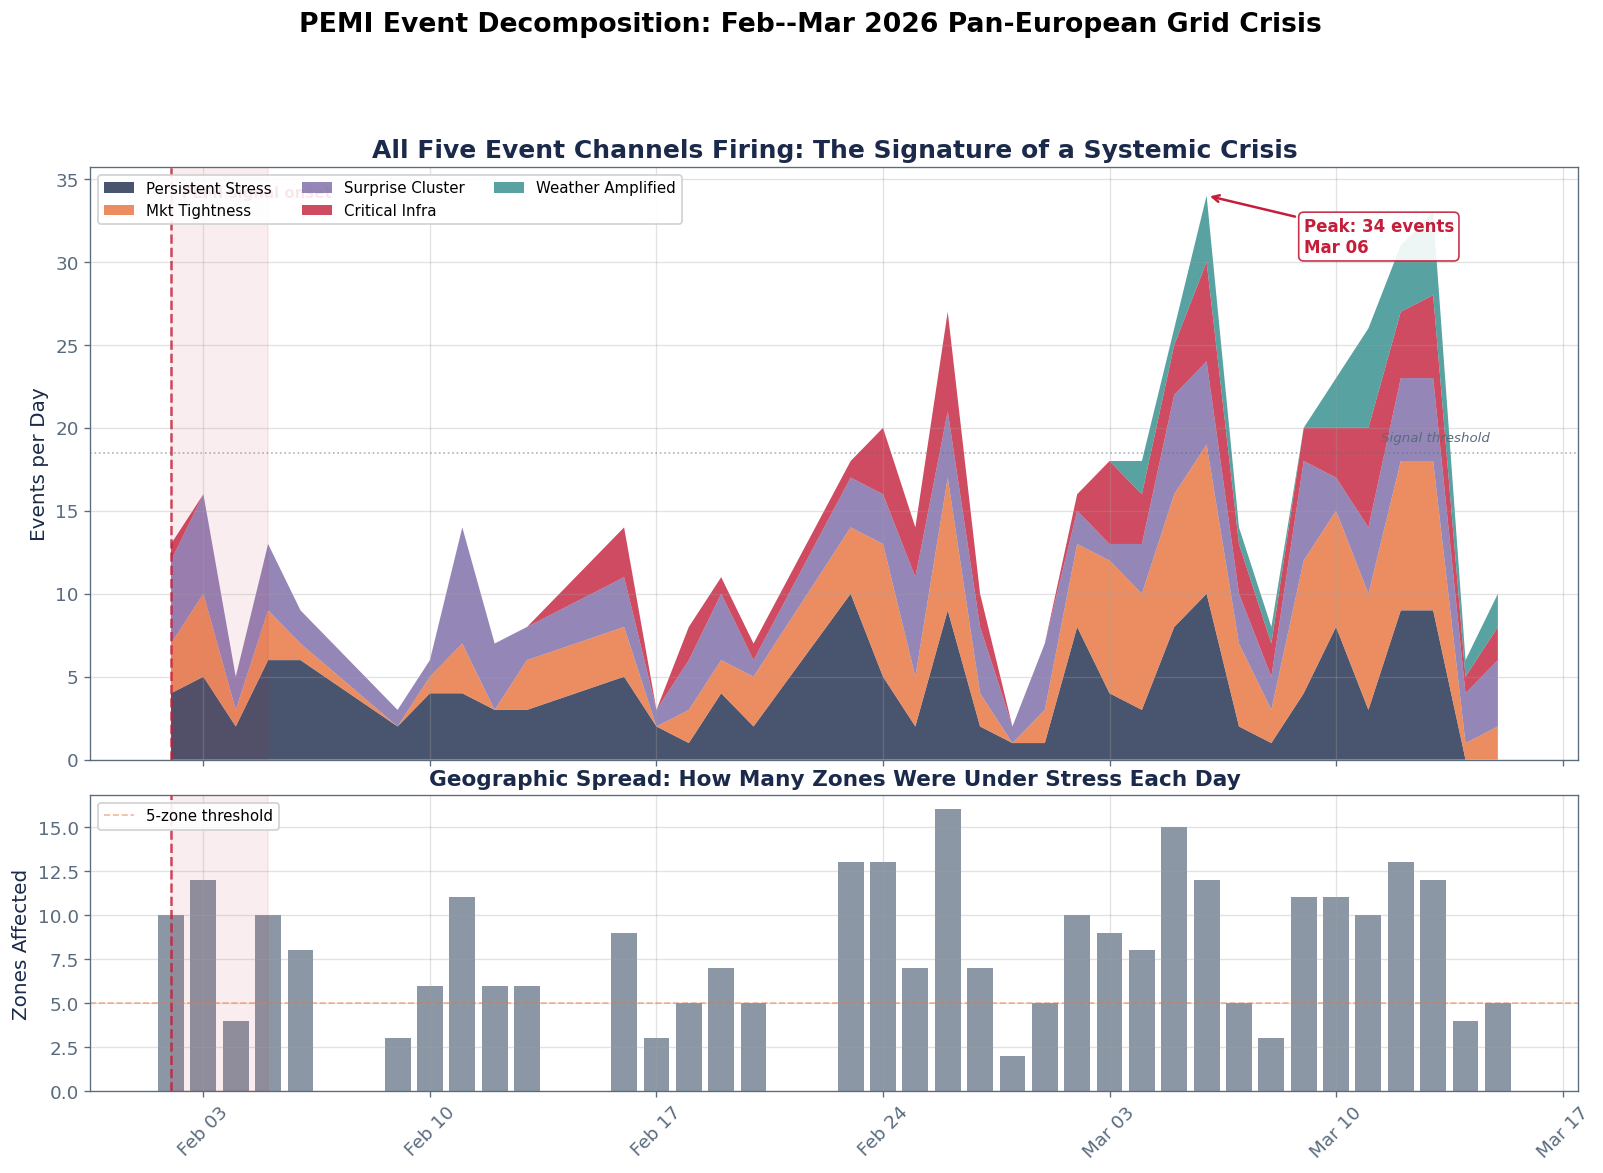
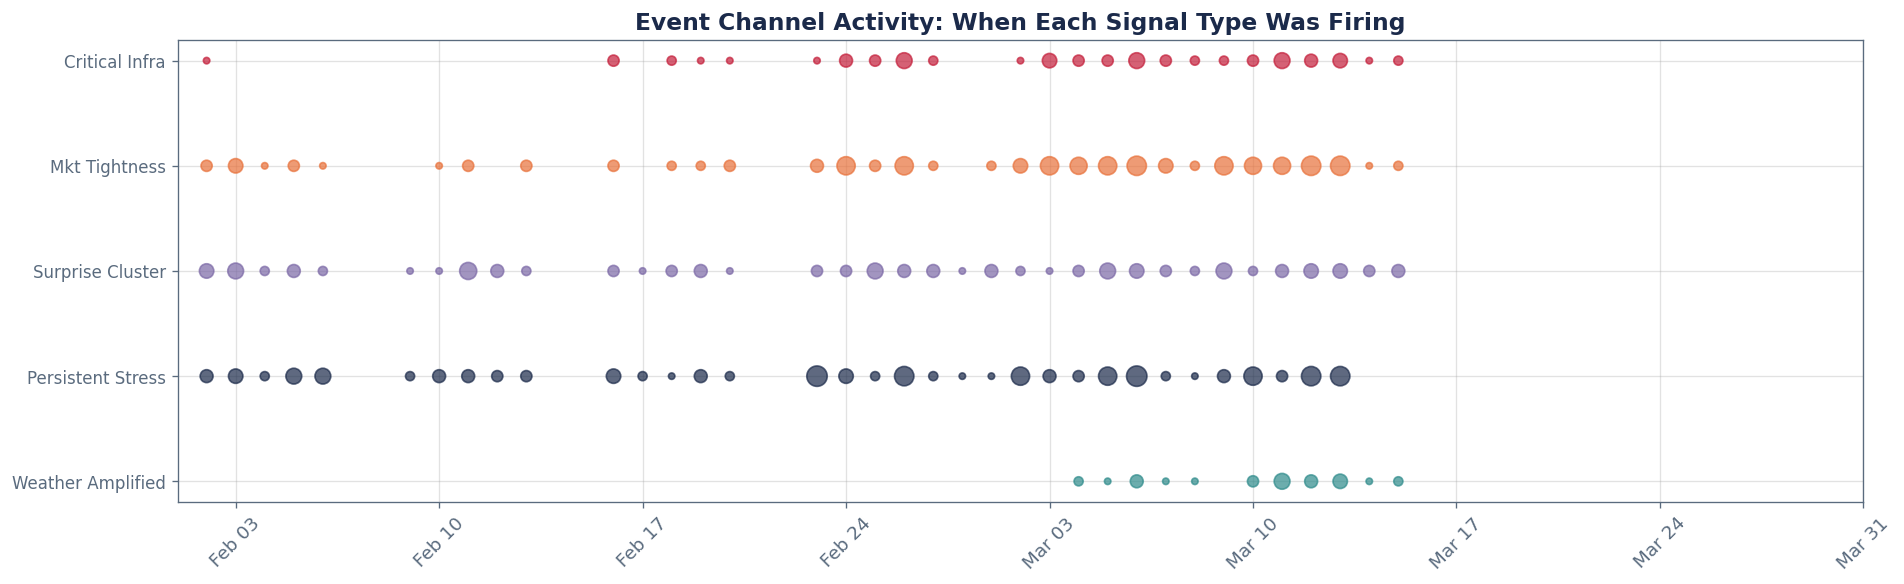
The March 2026 Pan-European Grid Crisis was the only period where all five PEMI
event channels fired simultaneously, escalating from scattered alerts across
20+ European zones into concentrated, multi-channel stress in Nordics and
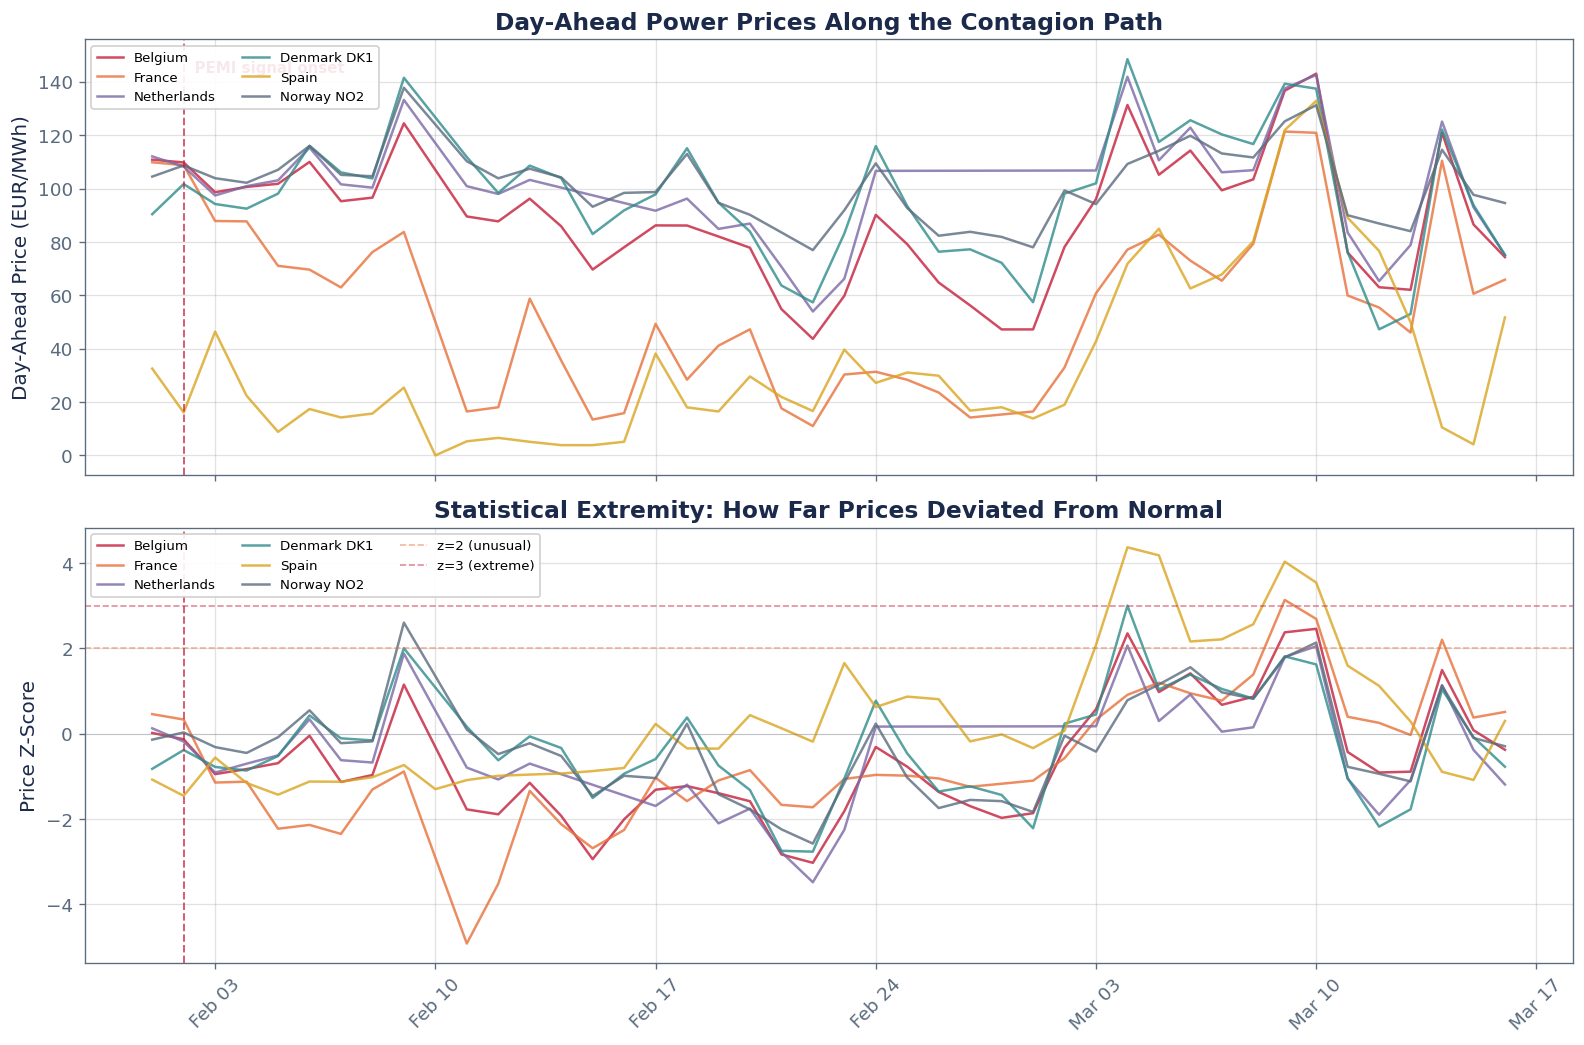
Benelux, with price z-scores exceeding 4 and gas-for-power substitution
spiking across 8 countries.
Why This Matters
- Five channels are not five ways of saying the same thing. Critical infra
alerts told you what went offline, surprise clusters told you the outages were
unplanned, persistent stress told you they were not resolving, market tightness
confirmed prices were responding, and weather amplification revealed the cold
snap compounding everything
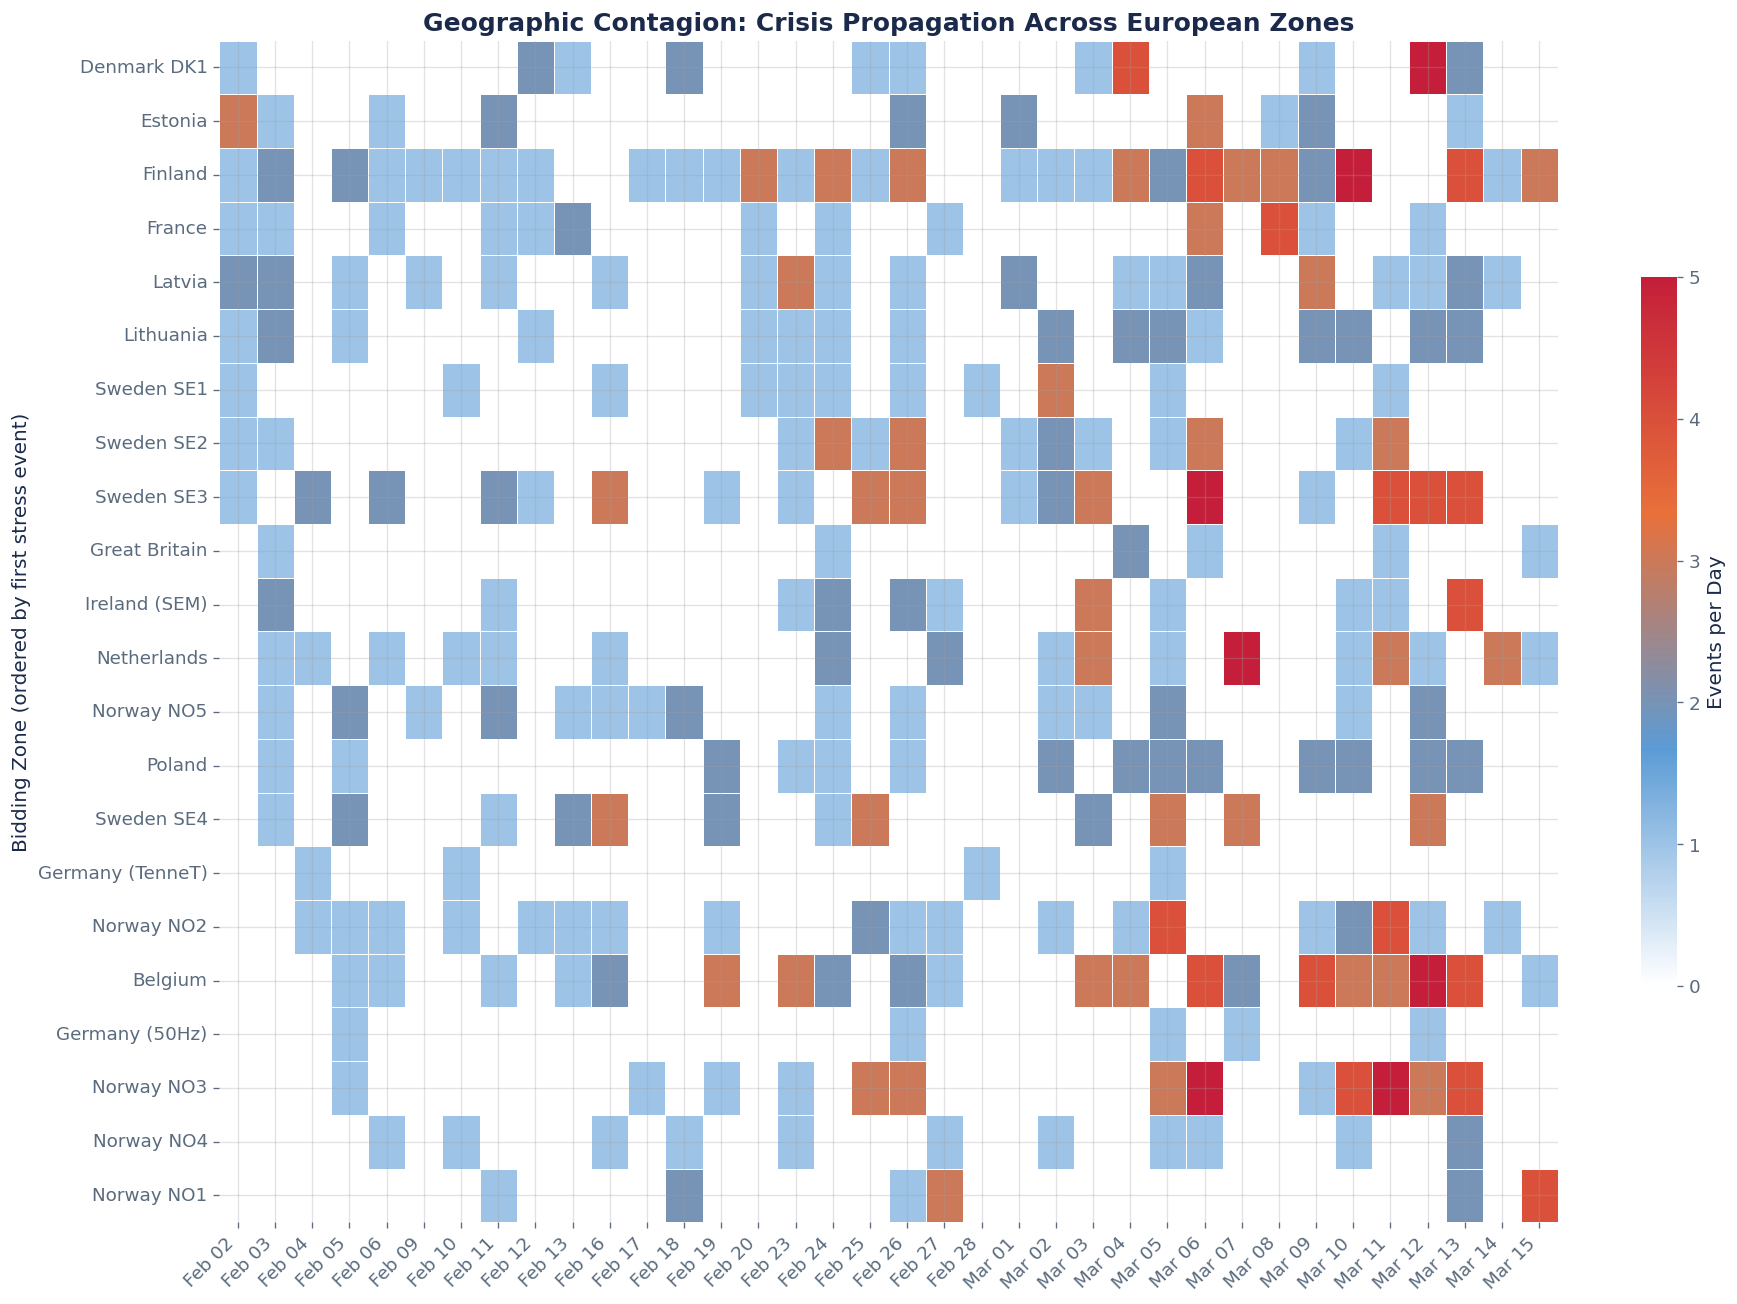
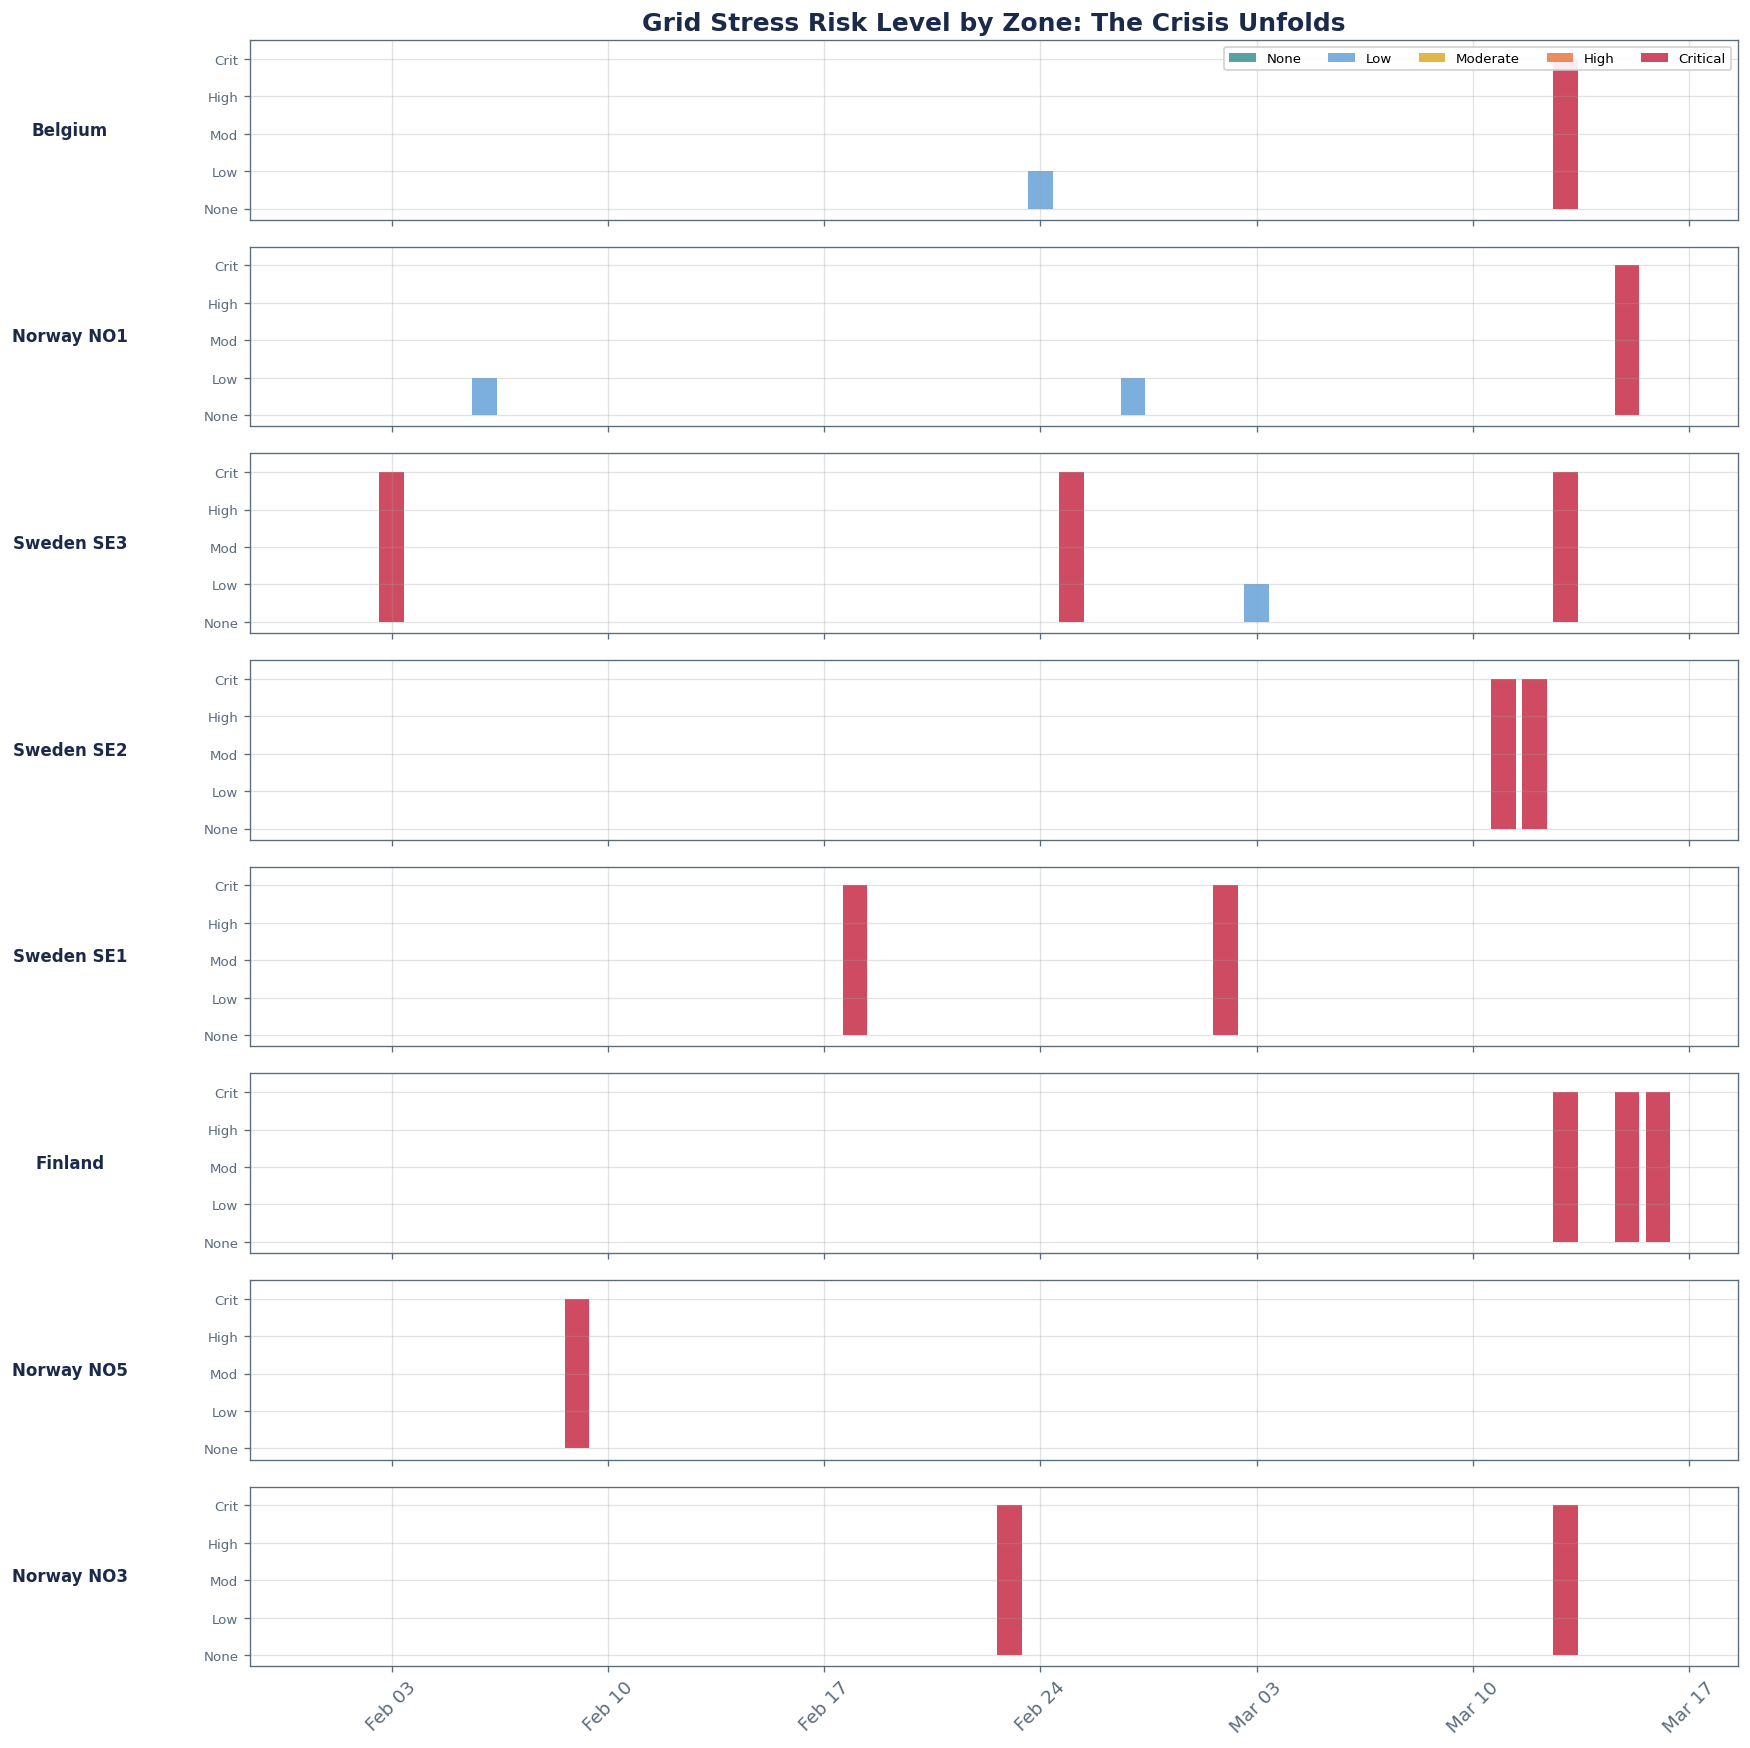
- Intensity concentration is the signal. Events appeared across Europe from
day one, but PEMI's zone-level decomposition showed the stress concentrating
in Nordics and Benelux. The shift from broad-but-mild to concentrated-and-severe
is the actionable transition
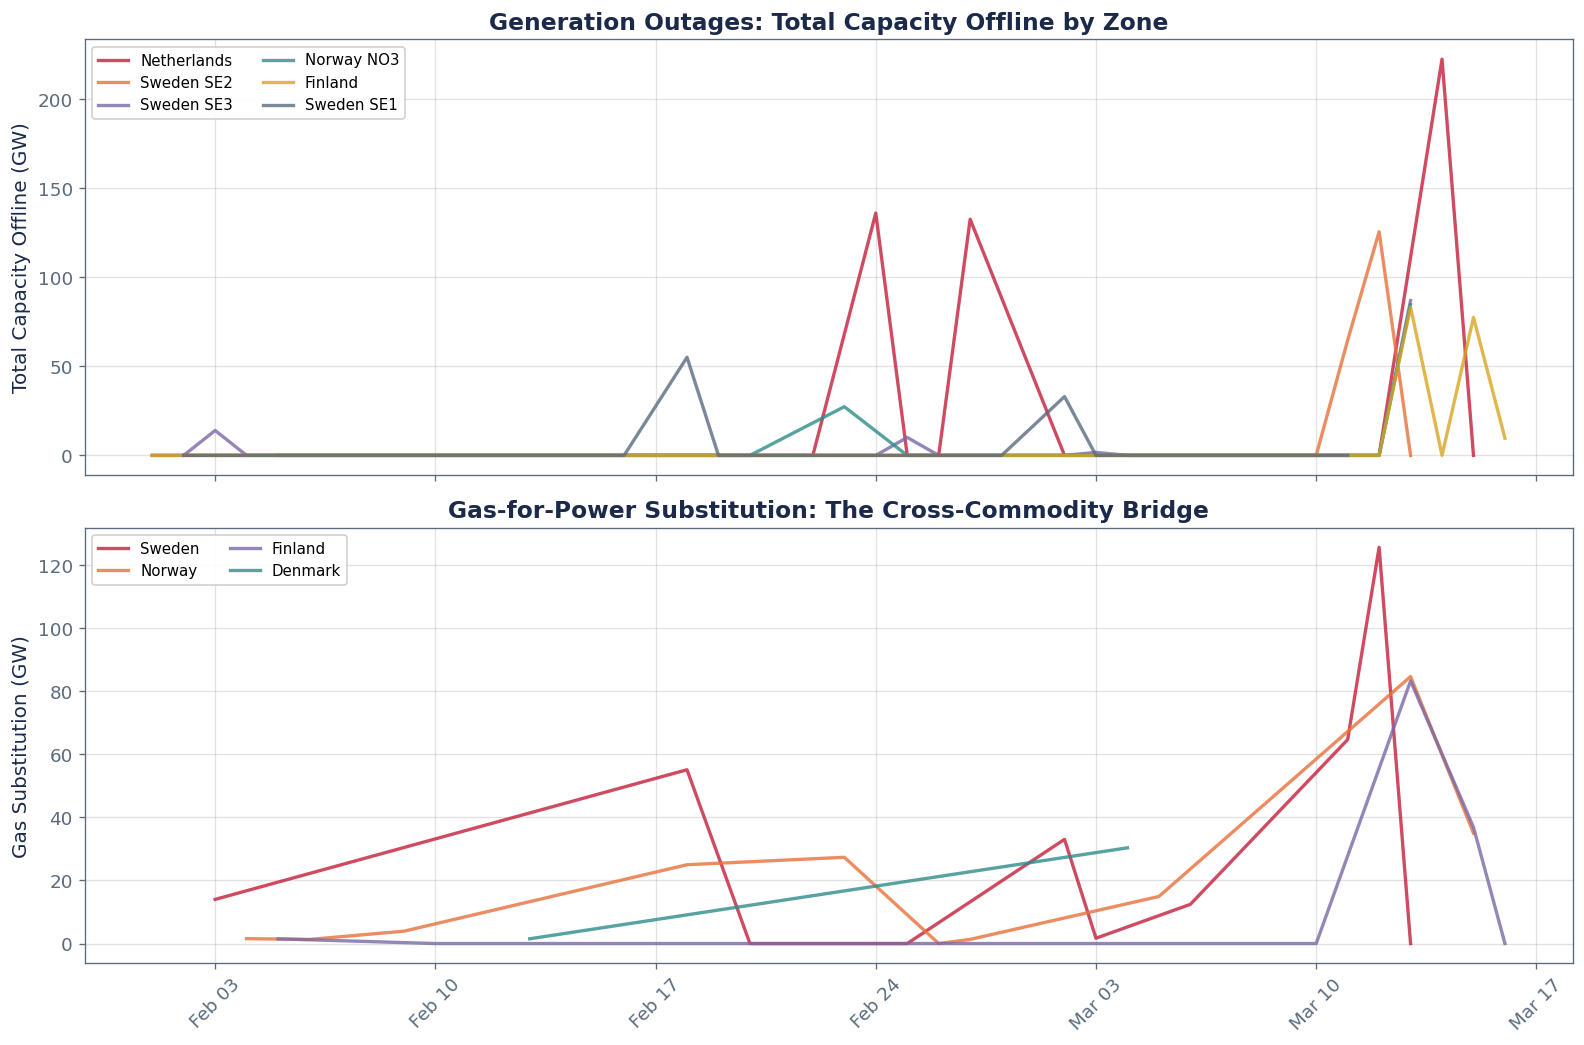
- Gas substitution is the cross-commodity bridge. PEMI quantifies how power
grid stress translates to gas demand (peak 64.9 GW in Norway), linking to
GBSI-EU and GLMI signals
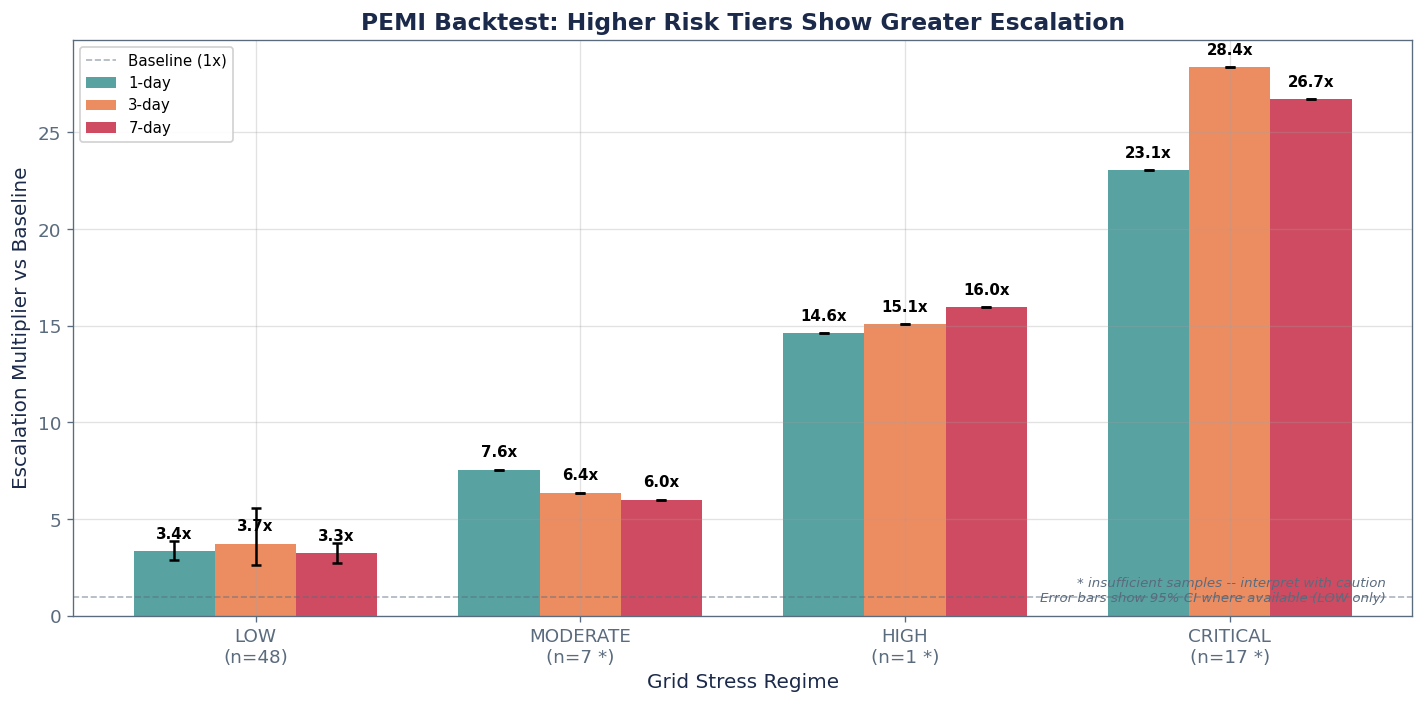
- Backtest shows monotonic escalation, with transparent caveats. LOW regime
shows 3.4x escalation (1d) with sufficient samples and CI [4.9-6.6].
CRITICAL shows 24.3x but n=15. Directionally strong but CIs unavailable
- Persistence separates transient from chronic. LOW stress resolves within
days (0% survival at 3d). CRITICAL episodes persist (43% still active at 3d,
p90 duration of 4 days), consistent with multi-week fleet failures
What a Client Does With This
Power Trader:
- Watch the channel count: scattered single-channel alerts are noise. When 3+
channels fire in the same zone, that zone is transitioning from isolated outage
to systemic stress. All five firing simultaneously has only happened once
- The concentration shift is your positioning signal. When event density migrates
from dispersed to focused on specific zones, those zones are where forward
curves need repricing
- Persistent stress lasting >7 days means this is not a one-week maintenance event.
Re-price your forward curve accordingly
Gas Trader:
- Gas substitution features tell you how much incremental gas demand each GW of
generation offline creates. Cross-reference with GBSI-EU to understand whether
the gas market can absorb it or whether TTF spikes
- Weather amplification + critical infra = worst case for gas demand. Size your
exposure to gas-for-power before the cold snap arrives, not after
Risk Manager:
- The channel count is your severity indicator. One channel firing = localized
event. Three+ channels = systemic risk. All five = the only systemic market event in
the dataset
- Persistence data tells you whether to treat this as a volatility spike (LOW:
resolves in days) or a regime shift (CRITICAL: 43% still active after 3 days,
p90 of 4 days)
- Supply pressure reaching 100% in Belgium means the zone has exhausted its
reserve margin. That is when interconnector dependency becomes critical
The Bottom Line
PEMI does not just say "the grid is stressed." It tells you how (which channels),
where (which zones), why (which triggers), how long (persistence and survival),
and whether it is getting worse (escalation trajectory). During March 2026, that
decomposition was the difference between seeing a single headline and understanding
a multi-week, multi-country cascade with quantifiable gas market consequences.