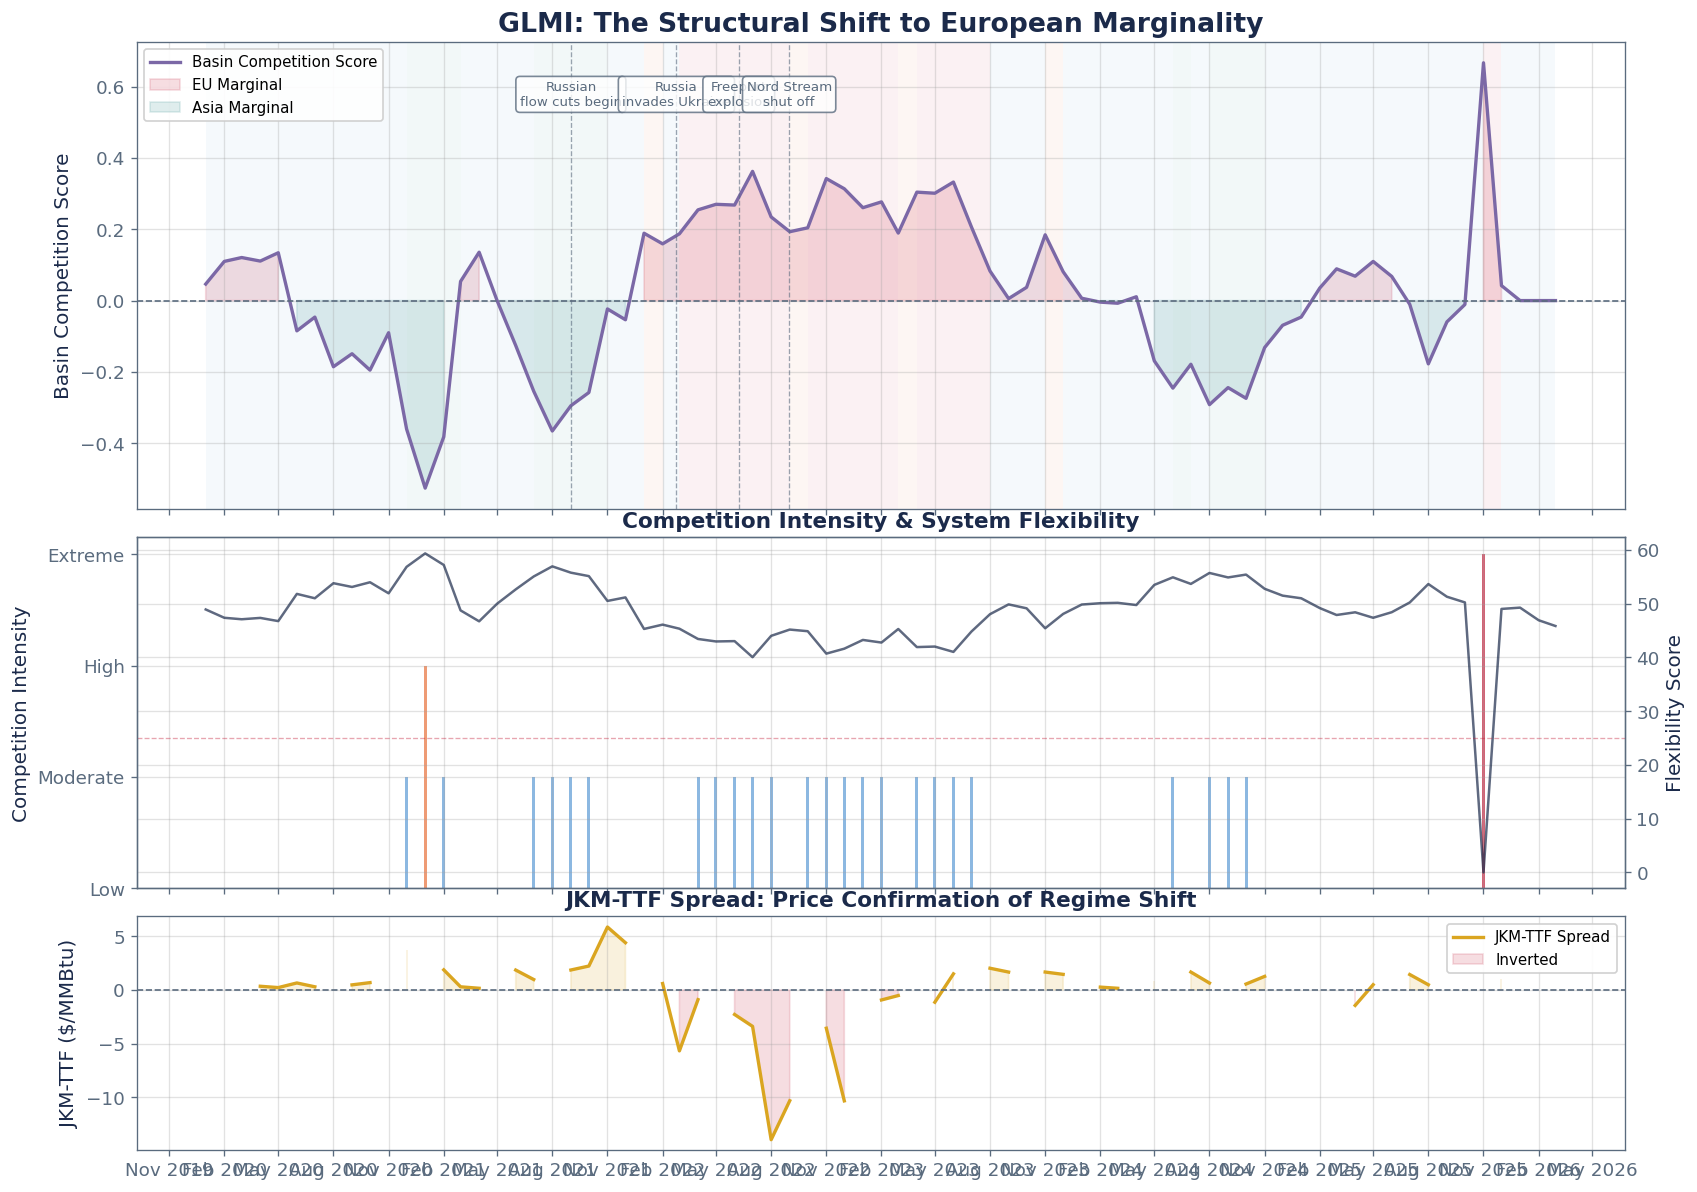
Chart 1: The Structural Shift: Full Timeline
Basin competition score over the full history, showing the regime transition from ASIA_MARGINAL through TIGHT_BALANCED to EU_MARGINAL.
Key Insight
Snowtrail's GLMI tracked Europe's transformation from a residual LNG buyer to the marginal price-setter, capturing the structural shift in competition intensity and cargo flows that defined 2021-2022.
Basin competition score over the full history, showing the regime transition from ASIA_MARGINAL through TIGHT_BALANCED to EU_MARGINAL.
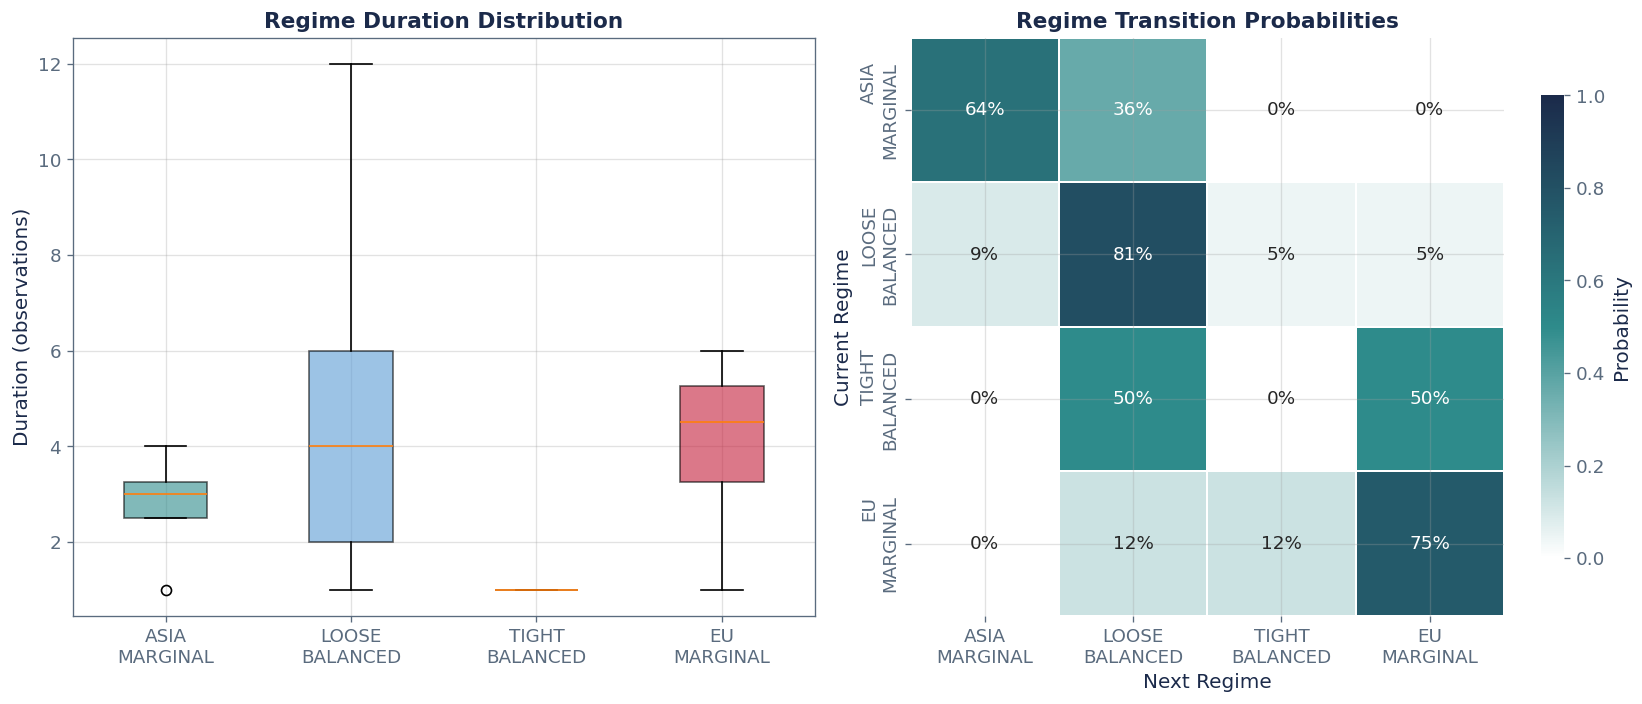
How long does each marginality regime persist? How do transitions occur? This validates that regime labels are tradeable (not flickering).
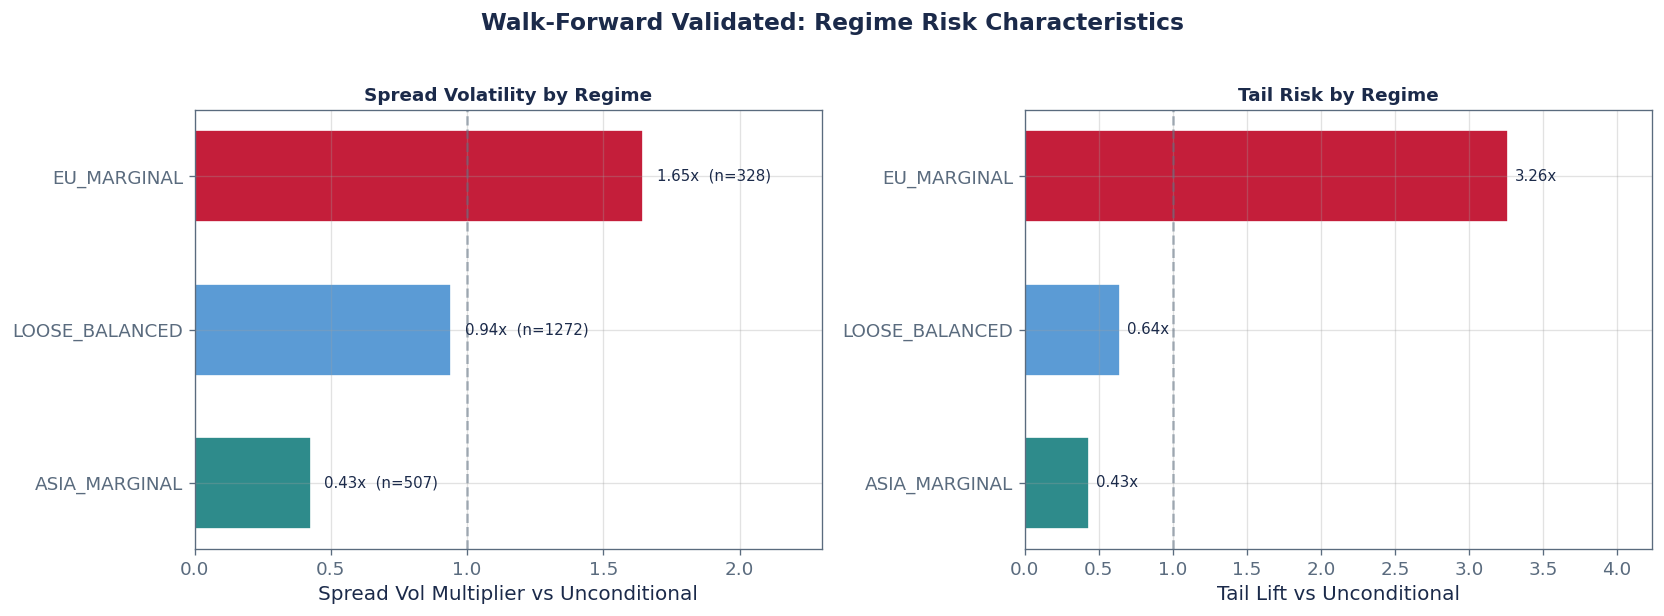
Does the marginality regime predict forward LNG price risk? The backtest framework provides pre-computed volatility multiplier and tail lift metrics.
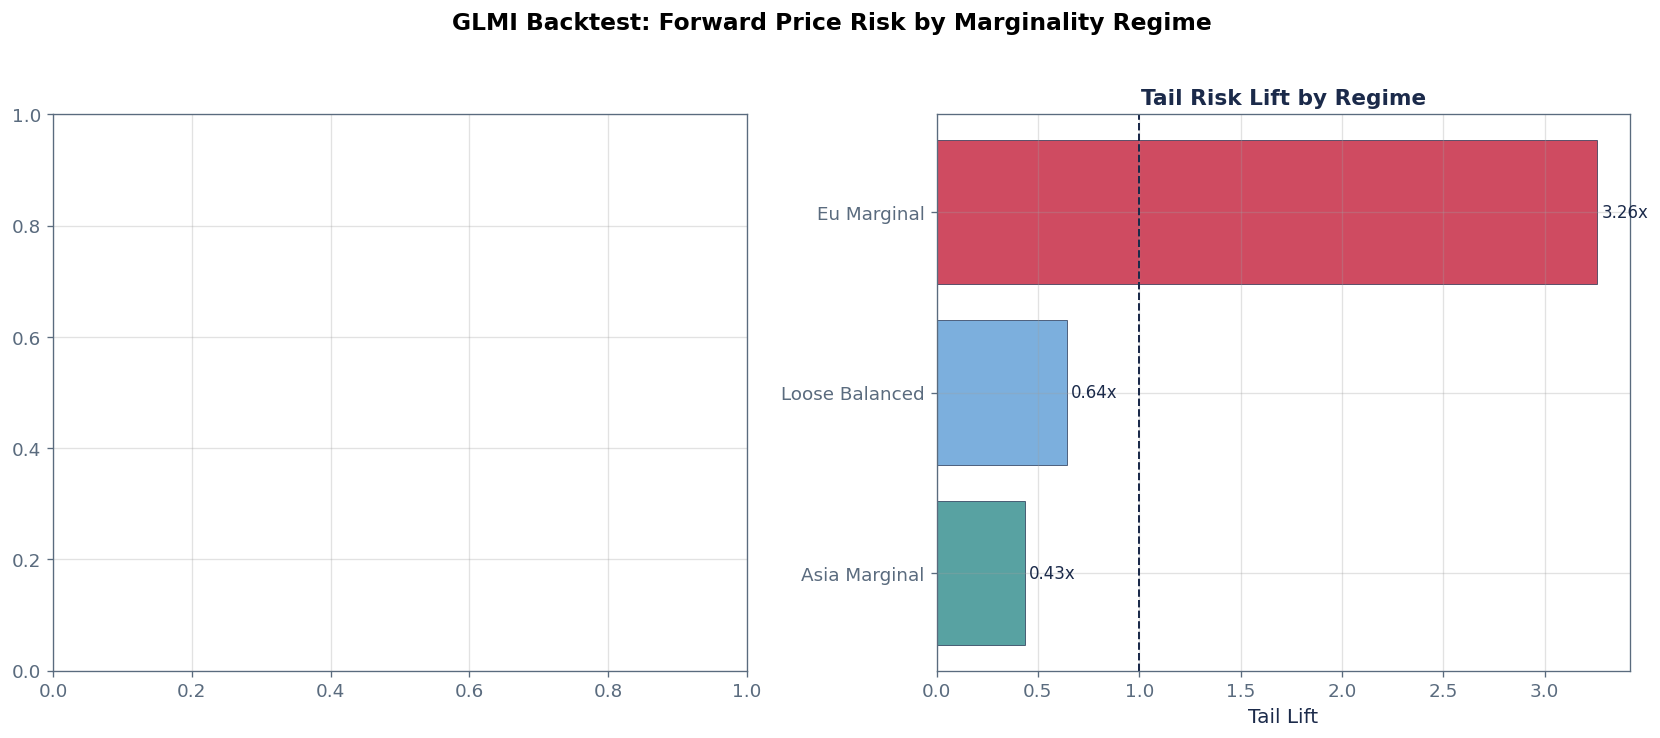
The GLMI backtest framework provides pre-computed, walk-forward validated metrics with institutional-grade sample sizes. These provide the primary evidence that marginality regime corresponds to who is clearing the market.
We present the backtest results first (adequate samples, FDR-corrected p-values), then supplement with an in-notebook replication on the EU basin's spread data (smaller sample, exploratory).
| Regime | N | Adequacy | Vol Multiplier | Tail Lift | Tail Rate | Avg Persistence (days) |
|---|---|---|---|---|---|---|
| Asia Marginal | 507 | ROBUST | 0.43x | 0.43x | 2.8% | 84 |
| Loose Balanced | 1,272 | ROBUST | 0.94x | 0.64x | 4.1% | 116 |
| Eu Marginal | 328 | ROBUST | 1.65x | 3.26x | 20.7% | 66 |
| Marginal basin | Months | Median JKM-TTF spread | Reading |
|---|---|---|---|
| ASIA_MARGINAL | 15 | 1.86 | Asia bidding hardest for the marginal cargo |
| LOOSE_BALANCED | 11 | 0.87 | Ample supply, neither basin pulling |
| EU_MARGINAL | 39 | 0.35 | Europe clearing the market, spread compressed |
Median JKM-TTF spread by marginal-basin call, monthly grain. ASIA_MARGINAL against EU_MARGINAL: Mann-Whitney p = 0.00025, rank-biserial +0.617. Continuous form: rho -0.593 against the spread level, block-permutation p = 0.0002 across 105 months.
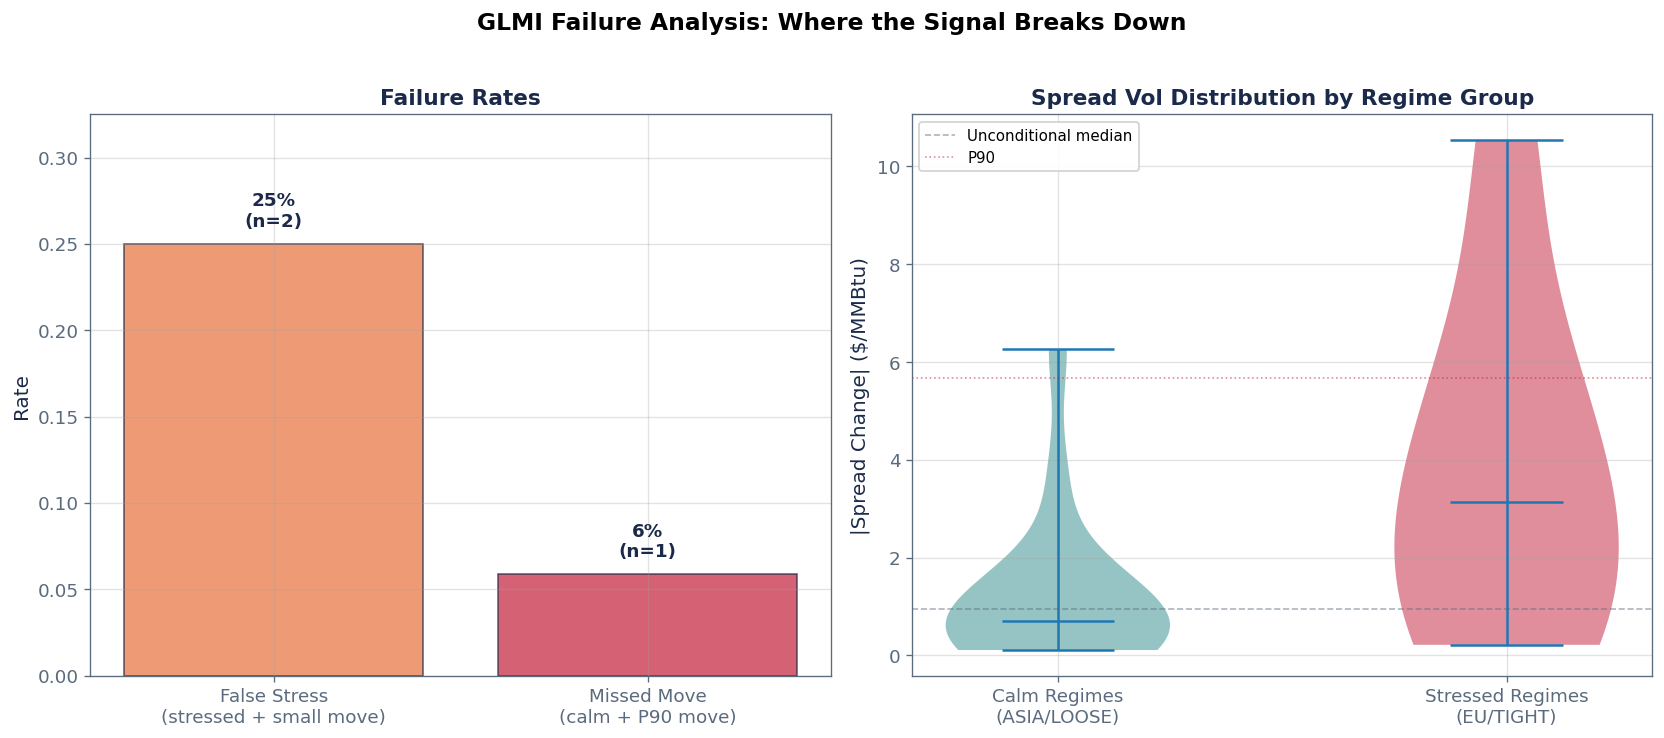
Two failure modes matter: 1. False stress: GLMI said EU_MARGINAL or TIGHT_BALANCED, but spread volatility was below median (the regime label overstated risk) 2. Missed move: GLMI said ASIA_MARGINAL or LOOSE_BALANCED, but a large spread move occurred (the regime label missed the risk)
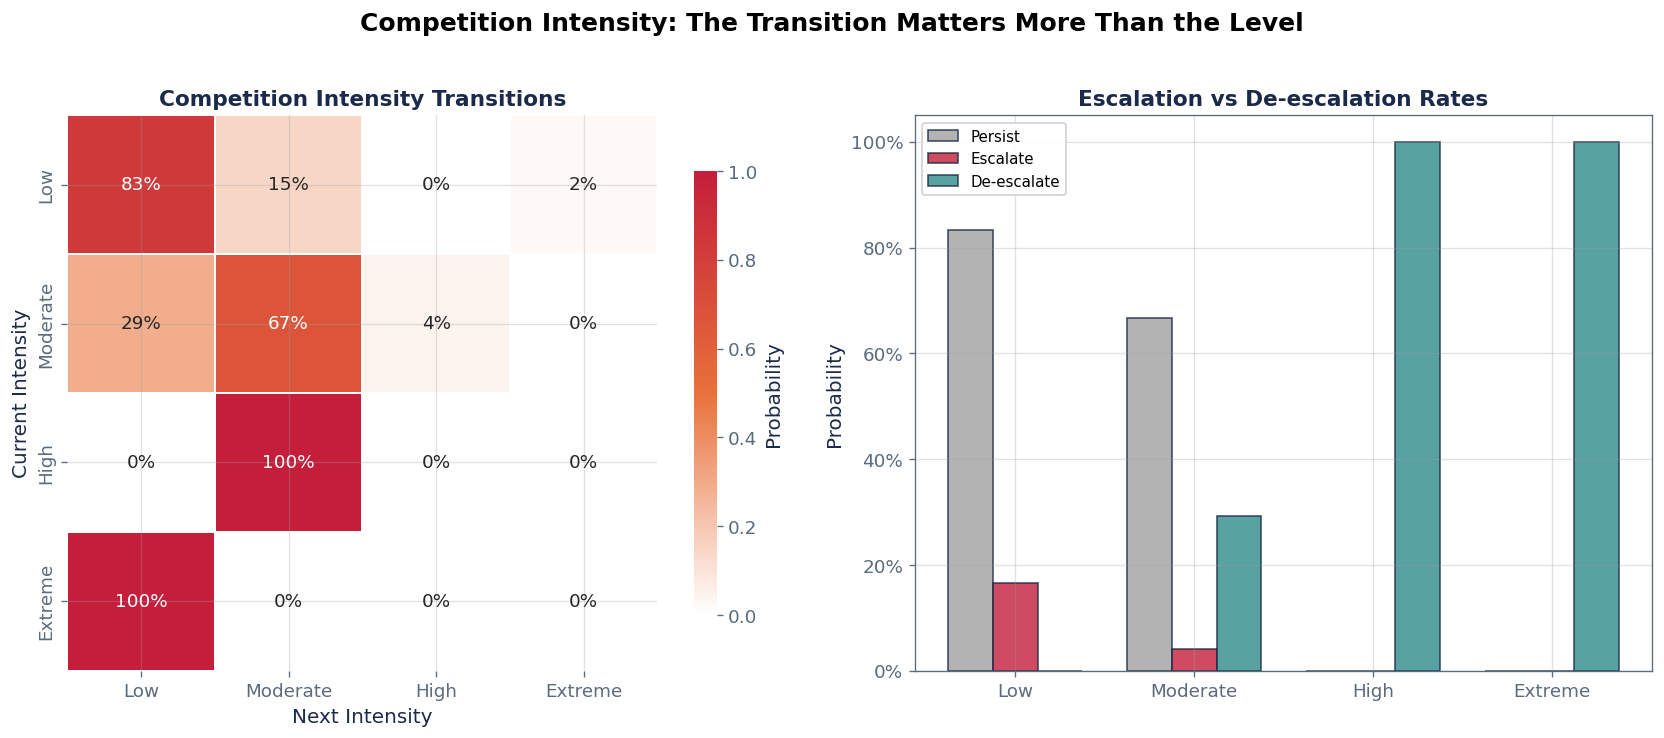
For GLMI, the direction equivalent is the competition intensity escalation path: LOW to MODERATE to HIGH to EXTREME. The transition matrix shows how sticky each intensity level is and how escalation/de-escalation occurs. This is the "transition matters more than the destination" insight applied to cross-basin competition.
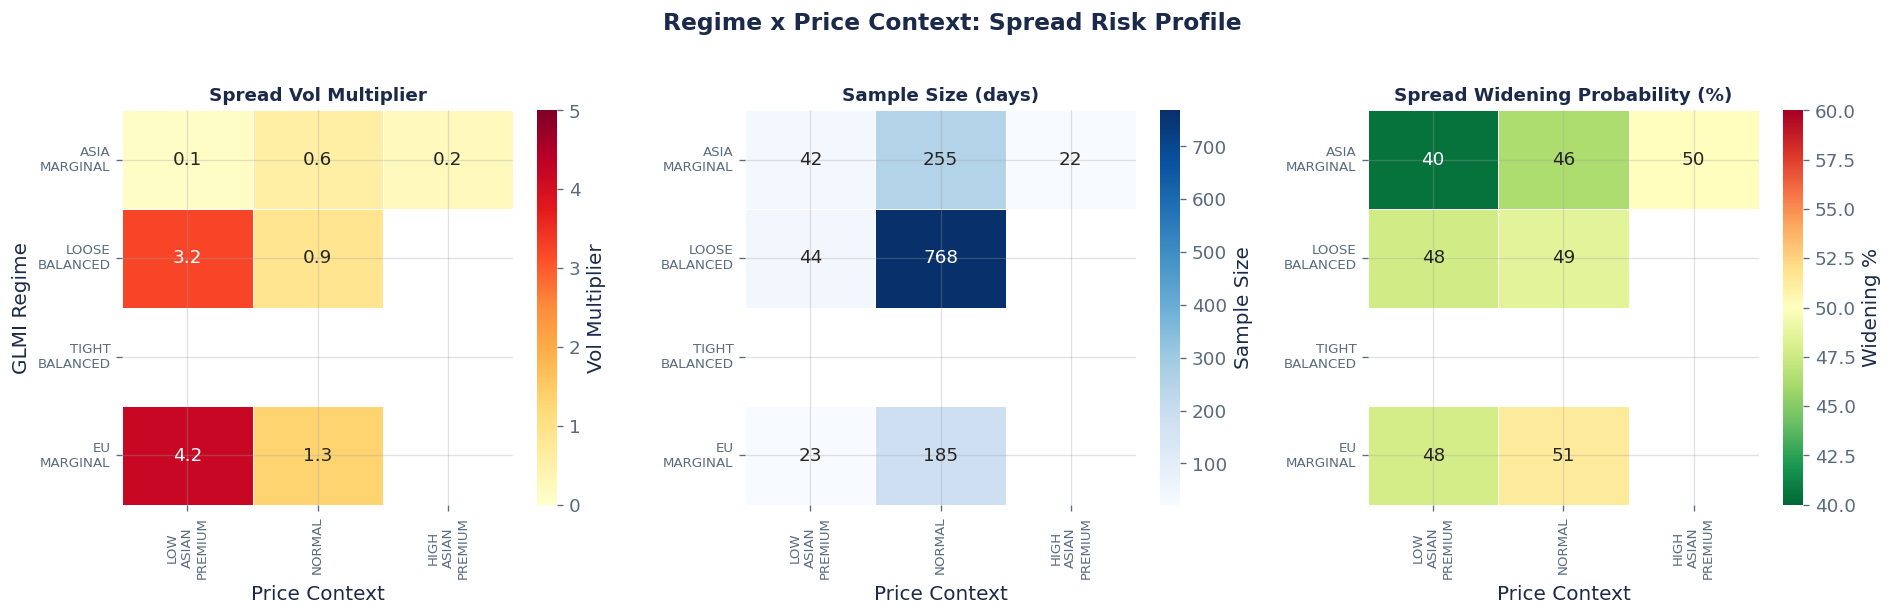
The institutional lookup table. For each combination of (marginality regime, spread regime), we show the observed spread volatility characteristics and the implied trading action.
| Regime | Spread Regime | N | Median |Change| | Vol Mult | P90 | Tail Lift |
|---|---|---|---|---|---|---|
| Asia Marginal | NORMAL | 4 | $1.145 | 1.20x | $3.013 | 0.53x |
| Loose Balanced | NORMAL | 12 | $0.393 | 0.41x | $1.415 | 0.25x |
| Eu Marginal | NORMAL | 5 | $2.640 | 2.78x | $9.029 | 1.59x |
| sample_n | vol_multiplier | tail_lift |
|---|---|---|
| 44 | 3.237000 | None |
| 768 | 0.884900 | None |
| 23 | 4.208000 | None |
| 185 | 1.332100 | None |
| 42 | 0.089700 | None |
| 255 | 0.553300 | None |
| 22 | 0.212200 | None |
Chronological log of all GLMI events showing how the marginality regime evolved through the 2021-2022 transition period.
The backtest framework does not just validate regimes in isolation. It tests every regime + price context combination to find which pairings produce the highest-conviction spread environments. This is the actionable layer: when GLMI tells you the regime AND the spread confirms it, what happens next?
GLMI's marginal-basin call tracks the JKM-TTF spread level closely: rank correlation of -0.593 against the spread, block-permutation p = 0.0002 across 105 months of overlapping history.
The sign is negative by construction, and that is the coherent direction. The basin competition score is EU tightness minus Asia tightness, so a higher score means Europe is the tighter basin, Europe bids up TTF, and the JKM-TTF spread narrows.
Read through the regime labels, the same relationship is plain:
What GLMI is telling you is which basin sets the price. It is a structural classification, not a volatility forecast and not a direction call.
GLMI tracked the most significant structural shift in global LNG markets in a decade. As Russian pipeline gas to Europe declined through 2021-2022, the basin competition score moved from negative (Asia marginal) to strongly positive (EU marginal). The JKM-TTF spread collapsed and inverted, confirming the signal's fundamentals-first approach.
GLMI updates monthly with the GIIGNL and IEA releases, so it is evaluated at monthly grain across 105 months. Scoring a monthly signal against daily prices would repeat each observation about twenty-one times and inflate the apparent sample.
- Coincident coherence: score vs JKM-TTF spread level, rho -0.593, p = 0.0002 (n = 105 months) - Regime separation: ASIA_MARGINAL median spread 1.86 against EU_MARGINAL 0.35, Mann-Whitney p = 0.00025 - Non-circular: the score is built from regasification utilisation and export routing. No price term feeds it - Point-in-time stable: re-run across 27 historical vintages, the correlation stays within -0.607 to -0.589
This is the strongest coherence result across the Snowtrail platform. It says GLMI identifies the clearing basin reliably. It does not say GLMI forecasts the spread.
LNG Spread Trader: - GLMI regime = EU_MARGINAL: Europe is clearing the market. Spread sits compressed or inverted, with no Asian bid supporting a widening. Historical median spread in this state is 0.35 - GLMI regime = ASIA_MARGINAL: Asia is bidding harder for the marginal cargo. Historical median spread is 1.86, five times the EU_MARGINAL level.
Use it to frame the spread environment, not to time an entry - Competition intensity transition MODERATE -> HIGH: the regime shift is underway. This is the entry signal, not the regime label itself - Flexibility score < 25: any new disruption produces outsized spread moves. Size up
Global Macro PM: - GLMI is the macro regime identifier for global gas. EU_MARGINAL = European energy crisis. ASIA_MARGINAL = normal winter dynamics - TIGHT_BALANCED is the highest-conviction regime: 2.33x vol multiplier means options are cheap relative to realized vol. Buy straddles on gas - Use the combination layer: TIGHT_BALANCED + NORMAL = 2.3x vol mult. This is where the vol surface systematically underprices realized risk
Utility / LNG Procurement: - EU_MARGINAL = your procurement costs are structurally elevated. Lock in term contracts now, do not wait for spot improvement - Competition intensity at EXTREME = you're competing with every Asian buyer for the same cargo. Activate backup supply agreements - When regime shifts back to LOOSE_BALANCED = procurement window opening. Negotiate aggressively on forward contracts
Risk Manager: - Vol multiplier and tail lift are direct inputs to regime-conditional VaR - Regime separation on the spread LEVEL is what carries information here. Standard VaR underestimates risk by that factor in this regime - The combination heatmap gives granular risk scaling: EU_MARGINAL + LOW_ASIAN_PREMIUM sits at a median spread of 0.35 vs ASIA_MARGINAL at 1.86. Same price context, ~47x difference in spread risk depending on the regime - Persistence metrics tell you how long to expect elevated risk
GLMI tracked the shift in who sets the marginal LNG price, from Asia to Europe, before the market fully priced it. The marginal-basin call tracks the spread level at rho -0.593 (p = 0.0002), the strongest coherence result on the platform. That regime discrimination is what separates a flow tracker from a regime intelligence system.
Request a demo to explore LNG market intelligence with your own use cases.
Request Demo