Part A: Your Dashboard Today
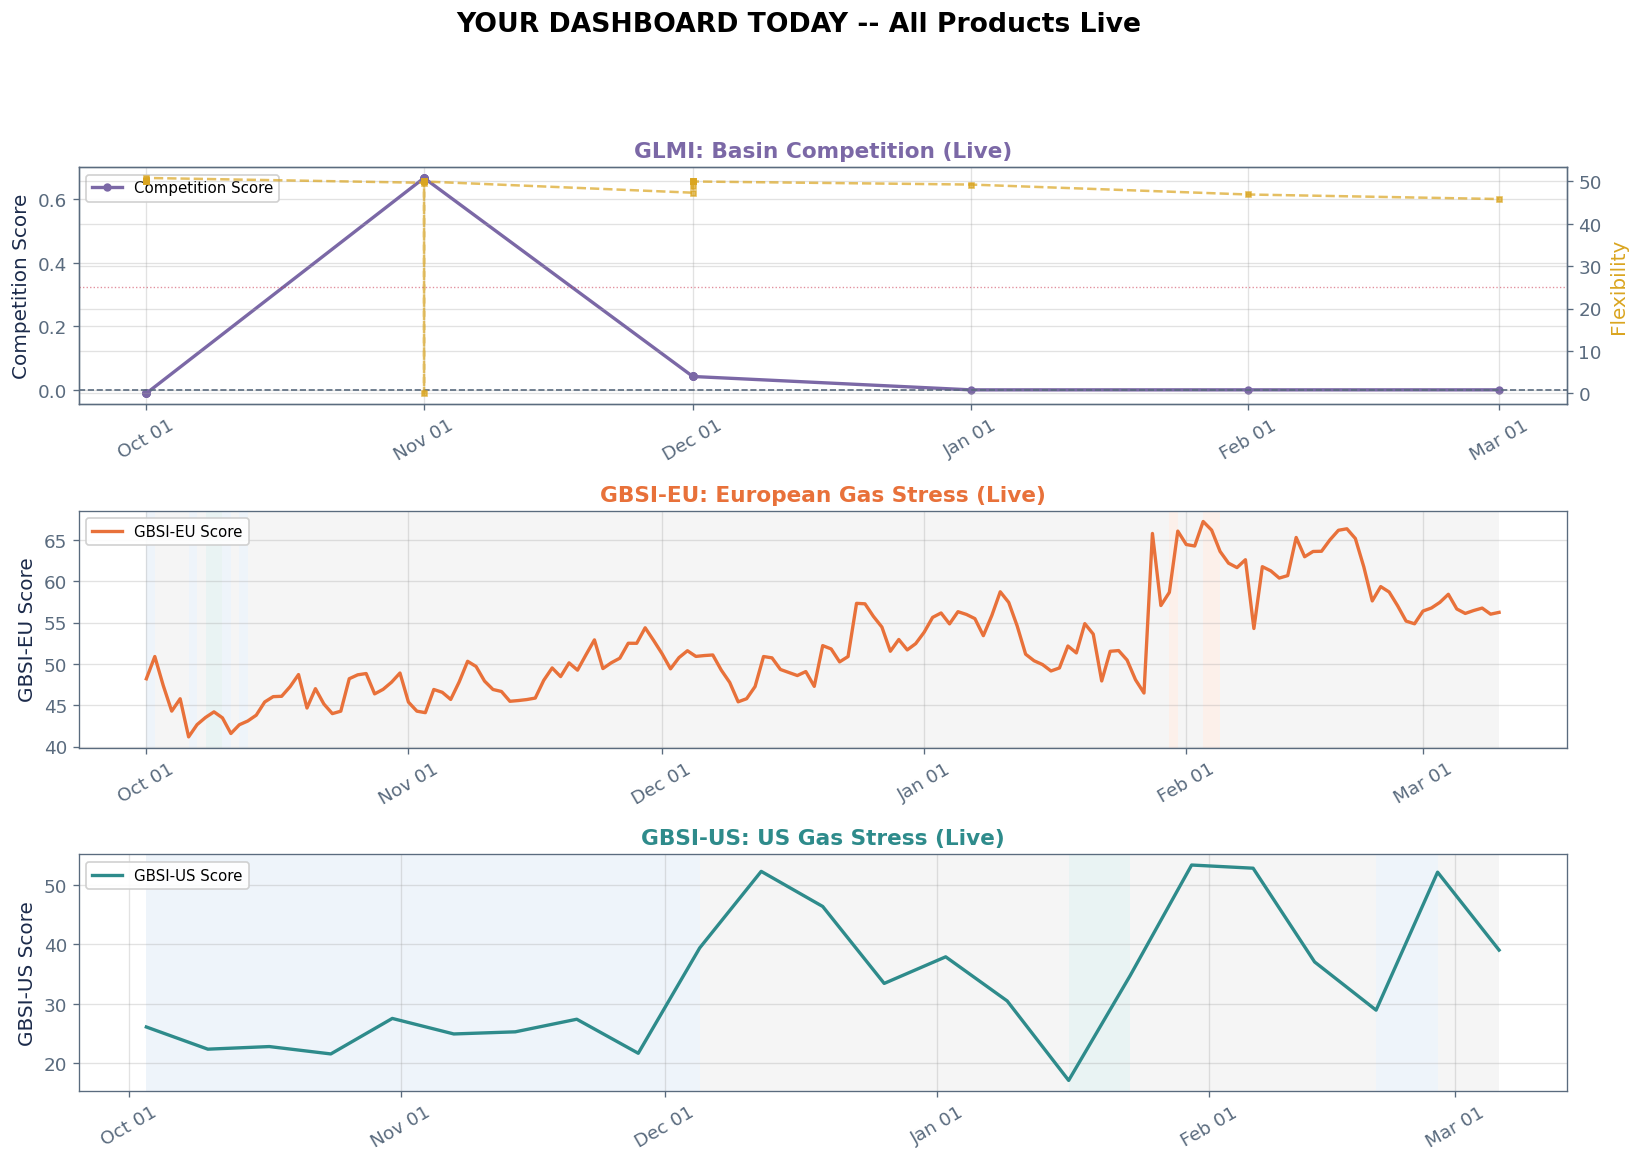
Current signal states across all three products. The market is calm. GBSI-EU and GBSI-US are BALANCED. This is your monitoring baseline. When Hormuz closes, these are the signals that will move first.
Key Insight
A live signal dashboard showing current market calm alongside historical stress analogues, demonstrating how Snowtrail signals would behave during a major supply disruption scenario.
Current signal states across all three products. The market is calm. GBSI-EU and GBSI-US are BALANCED. This is your monitoring baseline. When Hormuz closes, these are the signals that will move first.
The last time a major LNG supply node went offline. Freeport was a contained disruption: one terminal, one basin, 2 Bcf/d. The signals show how each product responded. Notably, GBSI-EU stress actually eased during summer 2022 (the EU's storage campaign absorbed the LNG loss).
This represents a lower-bound comparison for a Hormuz disruption. Freeport removed supply from one basin; Hormuz would remove supply from the system entirely (~11 Bcf/d, 5.5x larger).
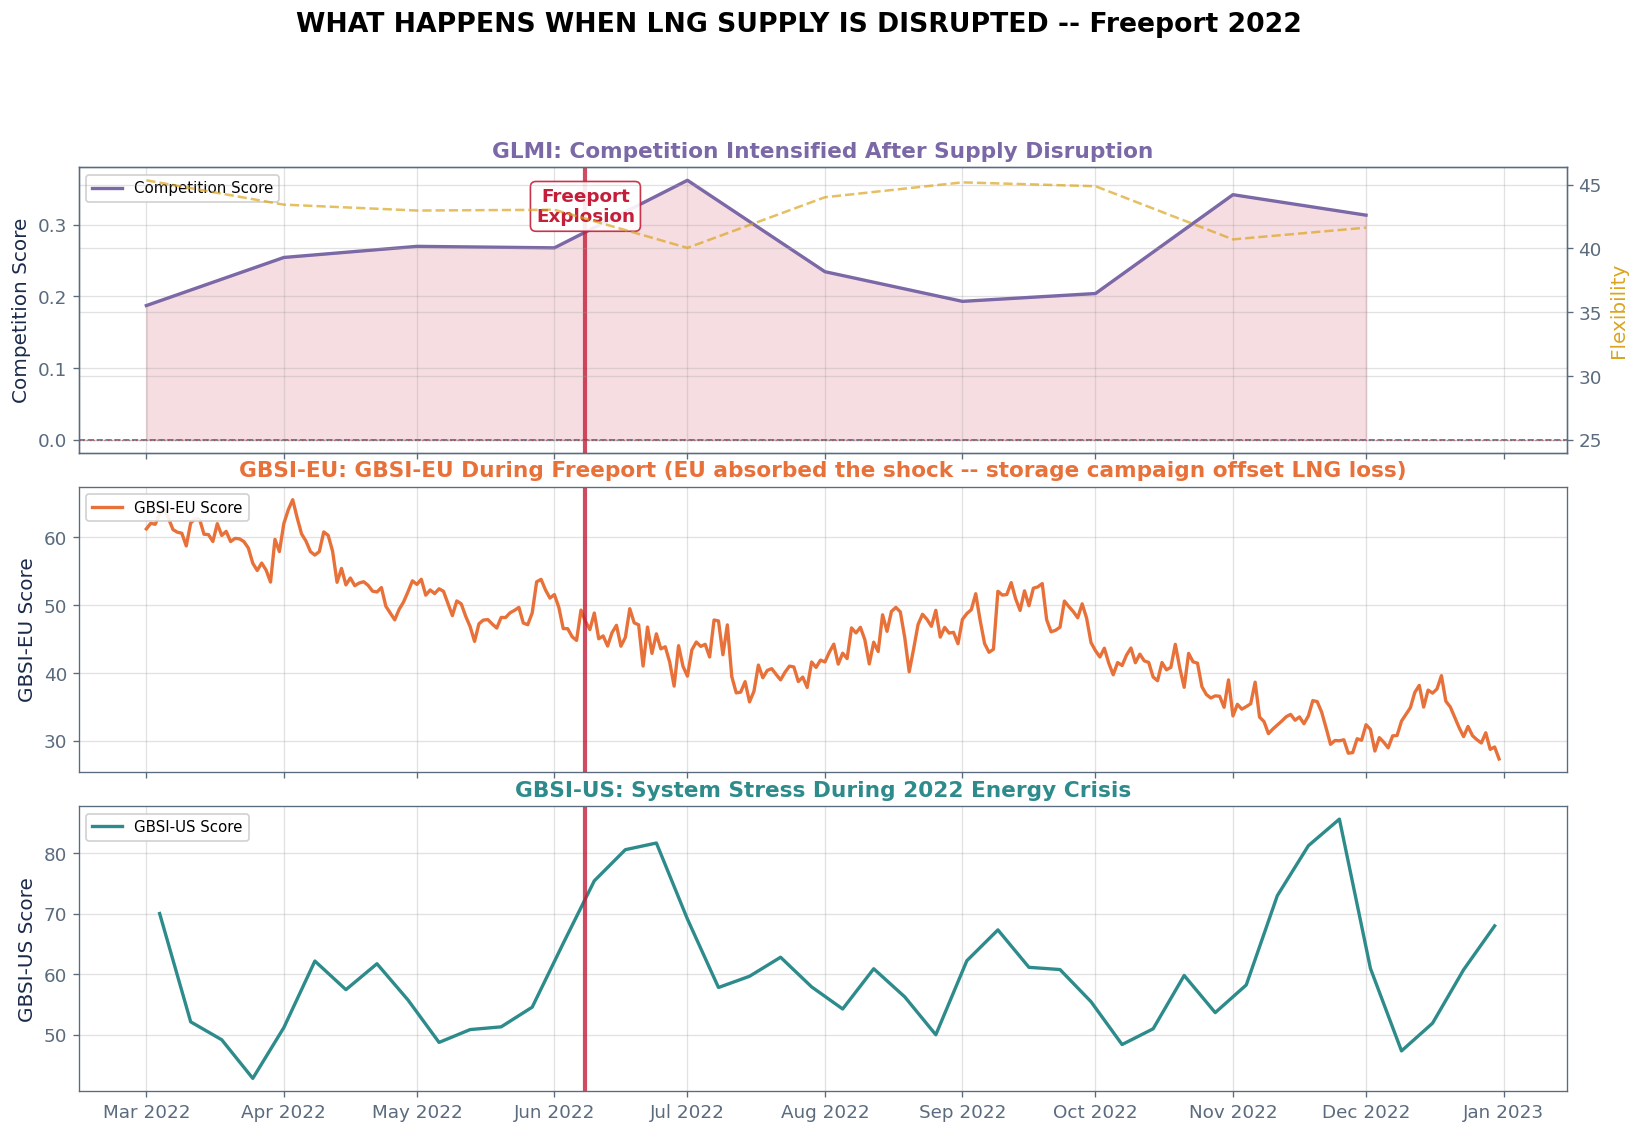
The left panel shows the current calm baseline, while the right panel shows the historical Freeport disruption. Note that GBSI-EU peak during Freeport may be lower than today's reading. this is because summer 2022's storage campaign was actively easing EU stress. The value isn't in the absolute level but in the signal dynamics: how quickly products respond, how direction shifts, and how GLMI competition behaves during a real disruption.
| Product | Signal | Current | Freeport Peak | Hormuz Scenario |
|---|---|---|---|---|
| GLMI | Competition Score | 0.0 | 0.4 | >>Freeport |
| GLMI | Competition Intensity | LOW | MODERATE | EXTREME |
| GLMI | Flexibility Score | 45.9 | 44.0 | <25 (collapse) |
| GLMI | Marginal Basin | LOOSE_BALANCED | EU_MARGINAL | >>Freeport |
| GBSI-EU | Score | 56.2 | 49.5 | CRITICAL (LNG cut off) |
| GBSI-EU | Regime | BALANCED | BALANCED | CRITICAL |
| GBSI-EU | Direction | STABLE | STABLE | TIGHTENING (acute) |
| GBSI-US | Score | 39.0 | 81.7 | TIGHT (export surge) |
| GBSI-US | Regime | BALANCED | BALANCED | TIGHT/STRESSED |
| GBSI-US | Direction | STABLE | LOOSENING | TIGHTENING (rapid) |
Bootstrap CIs on the pre/post Freeport score changes. Note that GBSI-EU shows a negative change (stress eased). The EU absorbed the Freeport shock. This makes the Hormuz scenario more significant rather than less. Freeport was absorbable because it affected one basin. Hormuz would not be, because it cuts supply to all basins simultaneously and at 5.5x the volume.
| Product | Signal | Pre Mean | Post Mean | Change | 95% CI | Significant | N Pre / Post |
|---|---|---|---|---|---|---|---|
| GBSI-US | System Stress Score | 55.7 | 63.9 | +8.2 | [+1.6, +15.0] | YES | 8 / 12 |
| GBSI-EU | System Stress Score | 50.2 | 43.6 | -6.5 | [-7.5, -5.5] | YES | 56 / 85 |
| Product | Signal | Freeport Change | Freeport 95% CI | Hormuz Estimate (5.5x) | Hormuz 95% CI (5.5x) | Caveat |
|---|---|---|---|---|---|---|
| GBSI-US | System Stress Score | +8.2 | [+1.6, +15.0] | +45.1 | [+8.8, +82.4] | Linear scaling (actual impact likely non-linear) |
| GBSI-EU | System Stress Score | -6.5 | [-7.5, -5.5] | -36.0 | [-41.5, -30.5] | Linear scaling (actual impact likely non-linear) |
A disruption in the Strait of Hormuz would remove roughly 11 Bcf/d of LNG supply, equivalent to more than five times the Freeport outage.
Based on the Freeport analogue, Snowtrail signals would likely move in the following order:
This signal sequence would indicate the market transitioning from a regional disruption to a global LNG allocation crisis. Traders should expect sharp TTF price escalation, widening global LNG spreads, and volatility across Henry Hub, JKM, and European power markets.
Column 1 (Today) proves the product is live. These are real signals from running pipelines, updated daily/weekly.
Column 2 (Freeport) proves the product captures supply disruptions, and captures them accurately. GBSI-EU eased during Freeport because the EU's structural position (storage campaign, demand destruction) absorbed the LNG loss. A vendor that would have shown "EU tightens" after Freeport would have been wrong. Snowtrail got it right.
The Hormuz difference: Freeport was a contained shock: one terminal, one basin. The EU could absorb it. Hormuz is uncontainable: 83% of Qatar's LNG (~11 Bcf/d) transits the Strait, supplying both Asia and Europe. No storage campaign absorbs that. Every product would fire simultaneously.
Before Hormuz (monitoring mode): - Dashboard open, all signals in baseline range - Set alerts: GLMI competition intensity -> HIGH, GBSI-EU direction -> TIGHTENING - Pre-define position sizes for each scenario escalation level - The Freeport bootstrap CIs give you the template for a contained disruption; Hormuz would exceed those bounds
When Hormuz happens (first 48 hours): - GLMI competition intensity jumps to EXTREME. This is the confirmation signal: not the headline, not the price spike, but the structured fundamental shift - GBSI-EU direction = TIGHTENING. Unlike Freeport, no offsetting structural buffer. Execute pre-planned positions: long TTF, long power - GBSI-US direction: both basins would tighten simultaneously (unlike Freeport where dynamics diverged). Long HH too - Flexibility score collapse = no shock absorber. Volatility will undershoot the move
Days 3-30 (monitoring the cascade): - Watch for direction to shift from TIGHTENING to STABLE = initial shock absorbed, market plateauing at elevated levels. Adjust holding period expectations - GLMI regime shift back toward LOOSE_BALANCED = diplomatic resolution or rerouting underway. Begin scaling out - GBSI-EU LOOSENING = genuine relief. Cover remaining longs
"Freeport was a contained shock: one terminal, one basin. The EU absorbed it. Snowtrail captured that correctly: GBSI-EU eased, not tightened. Hormuz is uncontainable: 5.5x the volume, both basins simultaneously. When that happens, do you want to be watching structured signals cascade in real-time, or reading the same Reuters headline as everyone else?"
Request a demo to explore LNG supply risk and scenario analysis with your own use cases.
Request Demo