Chart 1: The Information Cascade: Three-Panel Timeline
Shows how signals escalated across products over the episode. Each panel is one product, aligned on the same time axis. Henry Hub price overlay on the bottom panel shows the 10x spike.
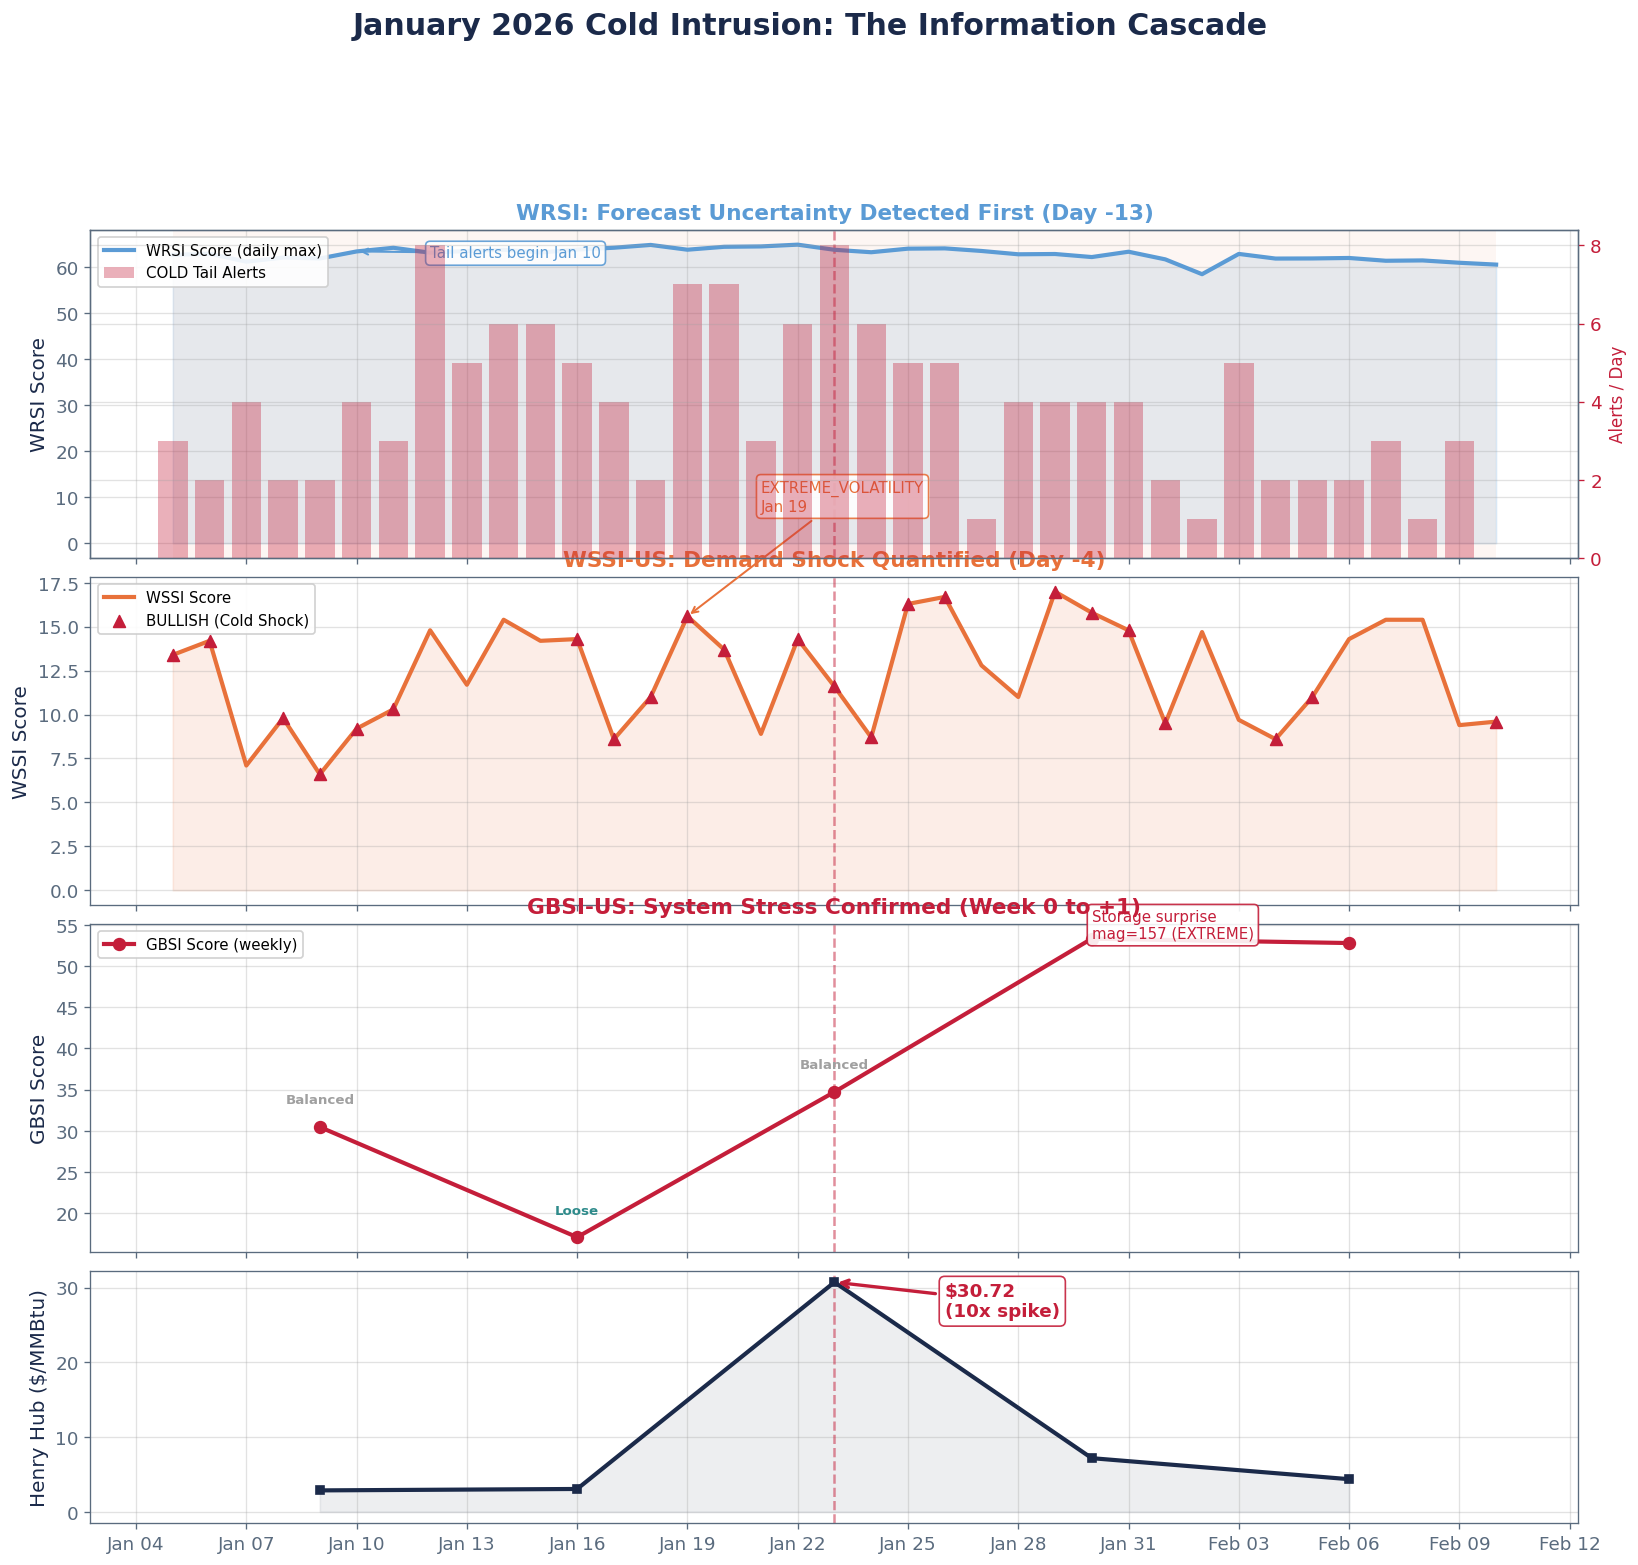
Key Insight
Snowtrail's WRSI flagged extreme cold risk 13 days before Henry Hub spiked from $3.06 to $30.72. WSSI-US and GBSI-US confirmed the cascade through storage and balance stress before the EIA report landed.
Shows how signals escalated across products over the episode. Each panel is one product, aligned on the same time axis. Henry Hub price overlay on the bottom panel shows the 10x spike.
Shows exactly what each product was signalling on each day from January 10 through February 6.
| Date | WRSI Score | WRSI Regime | Tail Alerts | Cold Dir | WSSI Score | WSSI Regime | WSSI Dir | GBSI Score | GBSI Regime | GBSI Dir | Henry Hub |
|---|---|---|---|---|---|---|---|---|---|---|---|
| Sat Jan 10 | 63 | TRANSITION | 4 | COOLING | 9 | CALM | BULLISH | ||||
| Sun Jan 11 | 64 | TRANSITION | 3 | COOLING | 10 | ELEVATED | BULLISH | ||||
| Mon Jan 12 | 63 | TRANSITION | 8 | WARMING | 15 | HIGH | NEUTRAL | ||||
| Fri Jan 16 | 64 | TRANSITION | 5 | WARMING | 14 | HIGH | BULLISH | 17 | LOOSE | LOOSENING | $3.06 |
| Mon Jan 19 | 64 | TRANSITION | 7 | WARMING | 16 | HIGH | BULLISH | ||||
| Fri Jan 23 | 64 | TRANSITION | 8 | COOLING | 12 | ELEVATED | BULLISH | 35 | BALANCED | STABLE | $30.72 |
| Fri Jan 30 | 62 | TRANSITION | 4 | WARMING | 16 | HIGH | BULLISH | 53 | BALANCED | TIGHTENING | $7.18 |
| Mon Feb 02 | 58 | TRANSITION | 1 | WARMING | 15 | HIGH | BEARISH | ||||
| Fri Feb 06 | 62 | TRANSITION | 2 | WARMING | 14 | HIGH | NEUTRAL | 53 | BALANCED | TIGHTENING | $4.37 |
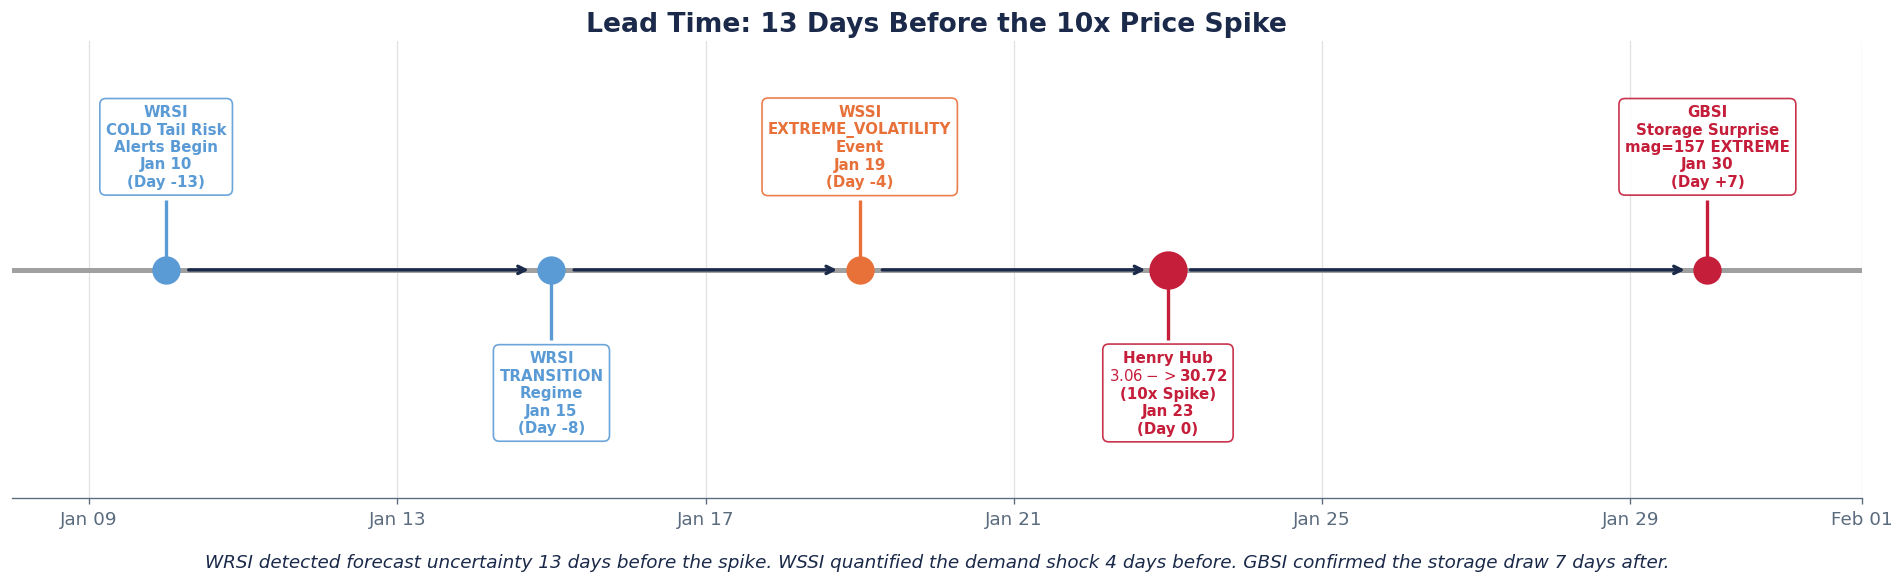
Horizontal timeline showing when each product first escalated relative to the price spike. The 10x Henry Hub move on January 23 is the anchor.
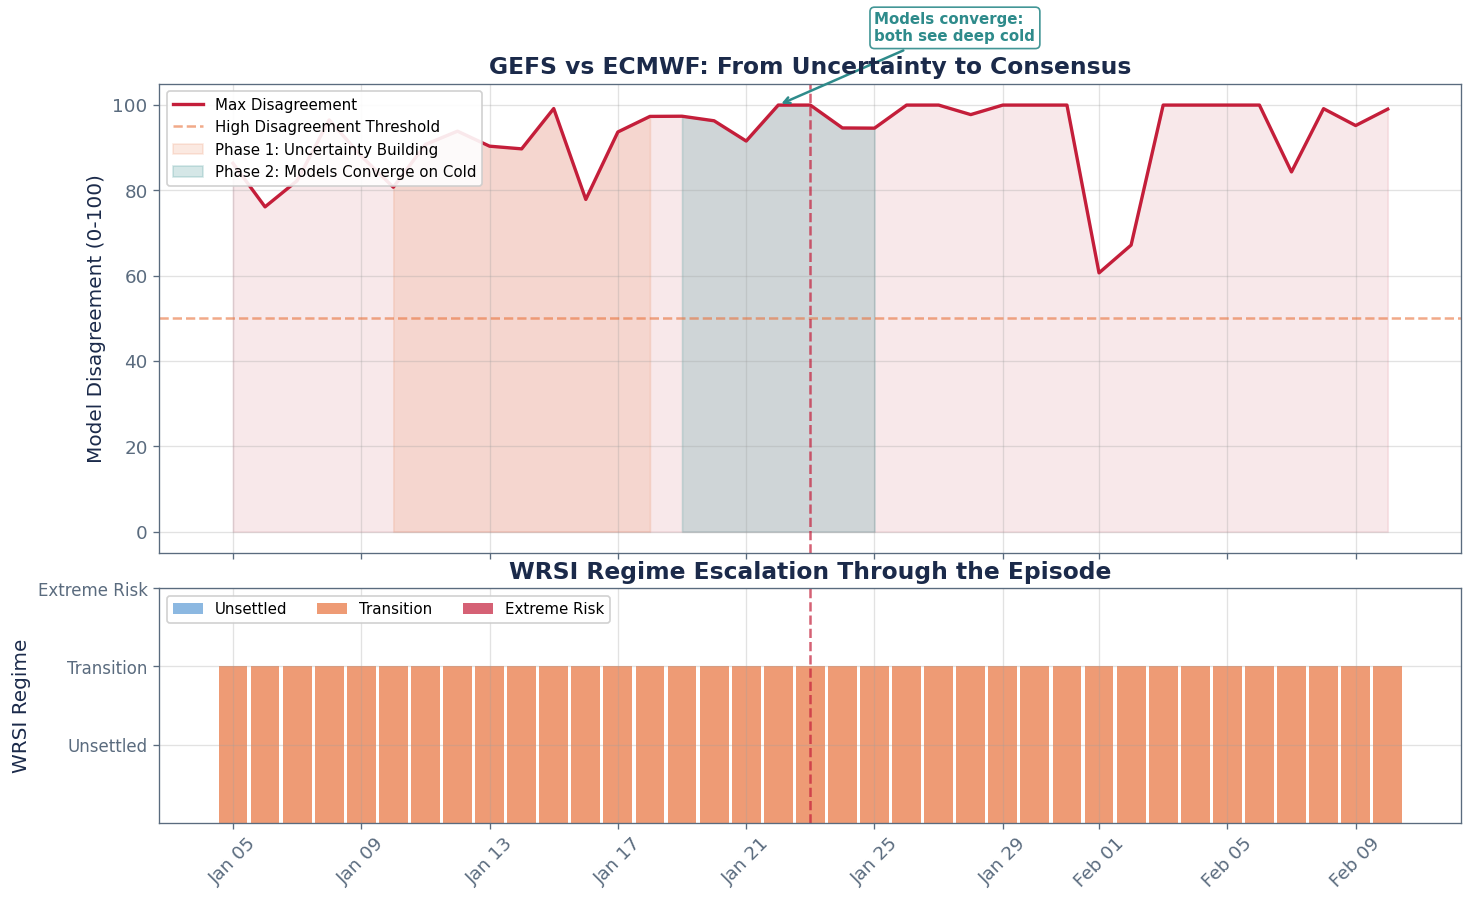
During the cold intrusion, GEFS and ECMWF followed a telling pattern: disagreement scores rose above 60 as models struggled with the cold forecast, then dropped sharply around January 20-23 as both models converged on the same conclusion: deep, sustained cold.
This resolution pattern is itself a signal: persistent disagreement followed by rapid convergence means the models stopped debating "if" and agreed on "how much." The dip in disagreement is not a false calm. It is the moment uncertainty crystallised into consensus. For a trader, that convergence is the confirmation to size up.
The bottom panel shows the WRSI regime escalating through the episode, confirming the signal was persistent, not transient.
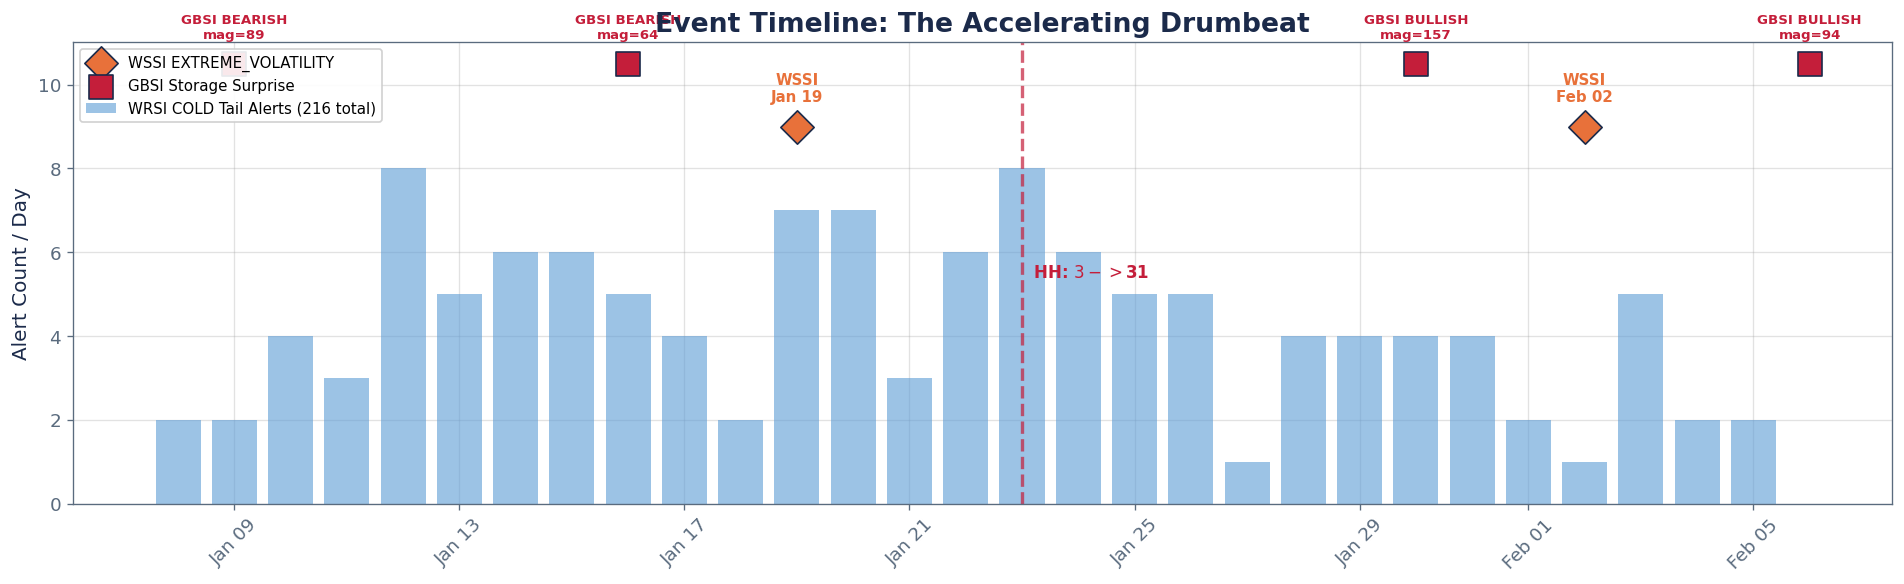
Discrete events from each product overlaid on a single timeline. Shows the accelerating drumbeat of alerts leading up to the spike.
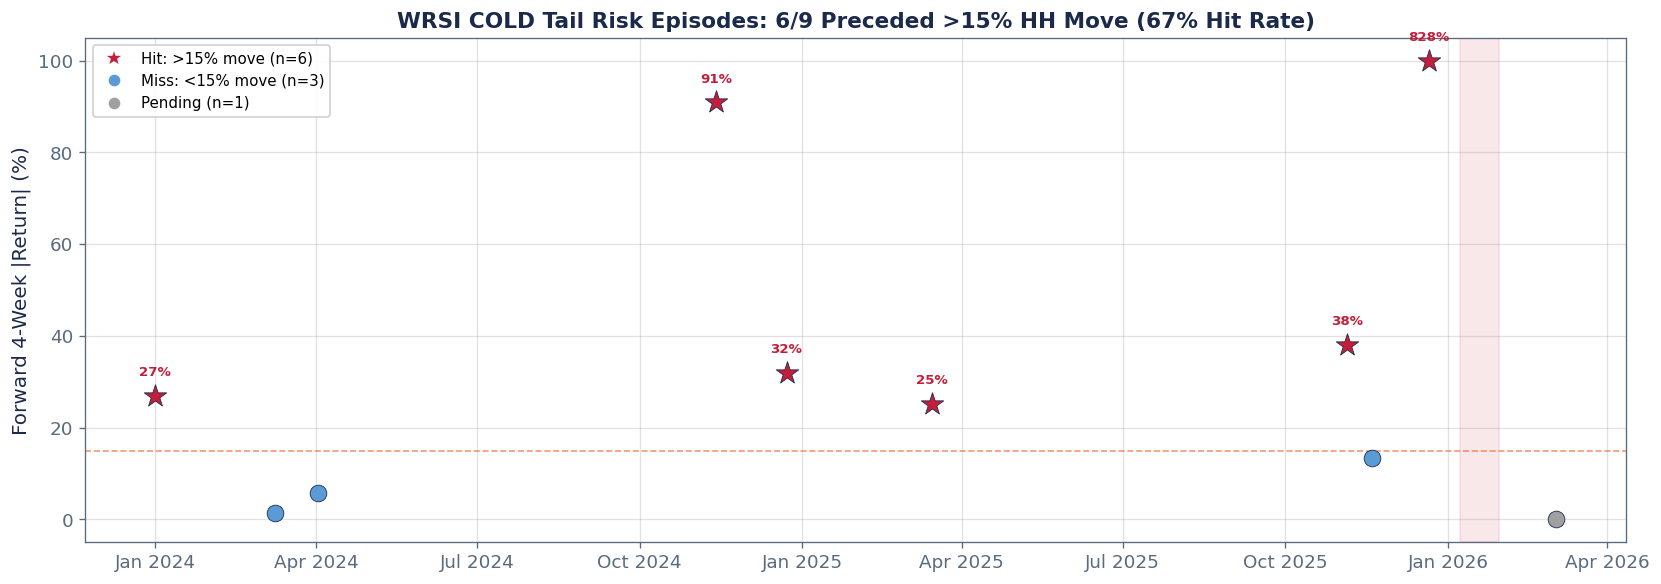
Across the full WRSI history, how often did COLD tail risk alerts actually precede significant Henry Hub price moves? This analysis clusters COLD alert episodes (consecutive days with alerts) and checks what fraction preceded a >15% absolute HH move within 4 weeks.
Important caveat: WRSI has been live since January 2024 (~2 years of history). With only ~10 episodes, confidence intervals are wide. As history builds, this analysis strengthens. We present it transparently because even a short track record with rigorous accounting is more credible than no track record at all.
| Episode Start | Duration (days) | Total Alerts | HH at Start | Fwd 4W |Return| | >15% Move |
|---|---|---|---|---|---|
| 2024-01-01 | 63 | 180 | $2.75 | 26.9% | Yes |
| 2024-03-09 | 14 | 16 | $1.38 | 1.4% | No |
| 2024-04-02 | 1 | 1 | $1.58 | 5.7% | No |
| 2024-11-13 | 37 | 85 | $1.65 | 90.9% | Yes |
| 2024-12-23 | 79 | 293 | $2.91 | 32.0% | Yes |
| 2025-03-15 | 3 | 3 | $3.93 | 25.2% | Yes |
| 2025-11-05 | 1 | 1 | $3.76 | 38.0% | Yes |
| 2025-11-19 | 29 | 80 | $4.13 | 13.3% | No |
| 2025-12-21 | 68 | 245 | $3.31 | 828.1% | Yes |
| 2026-03-03 | 11 | 10 | $3.10 | N/A | N/A |
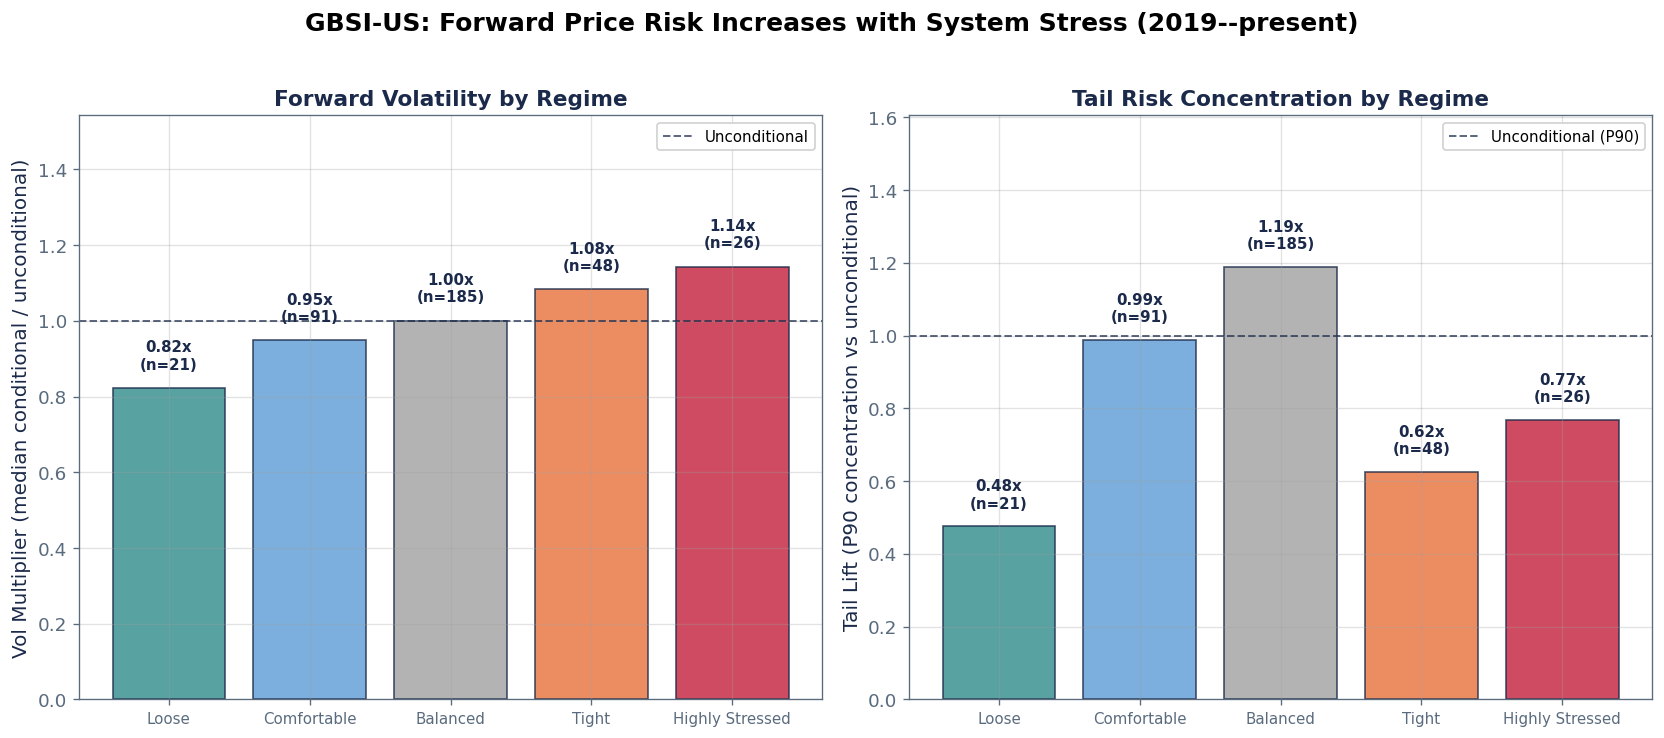
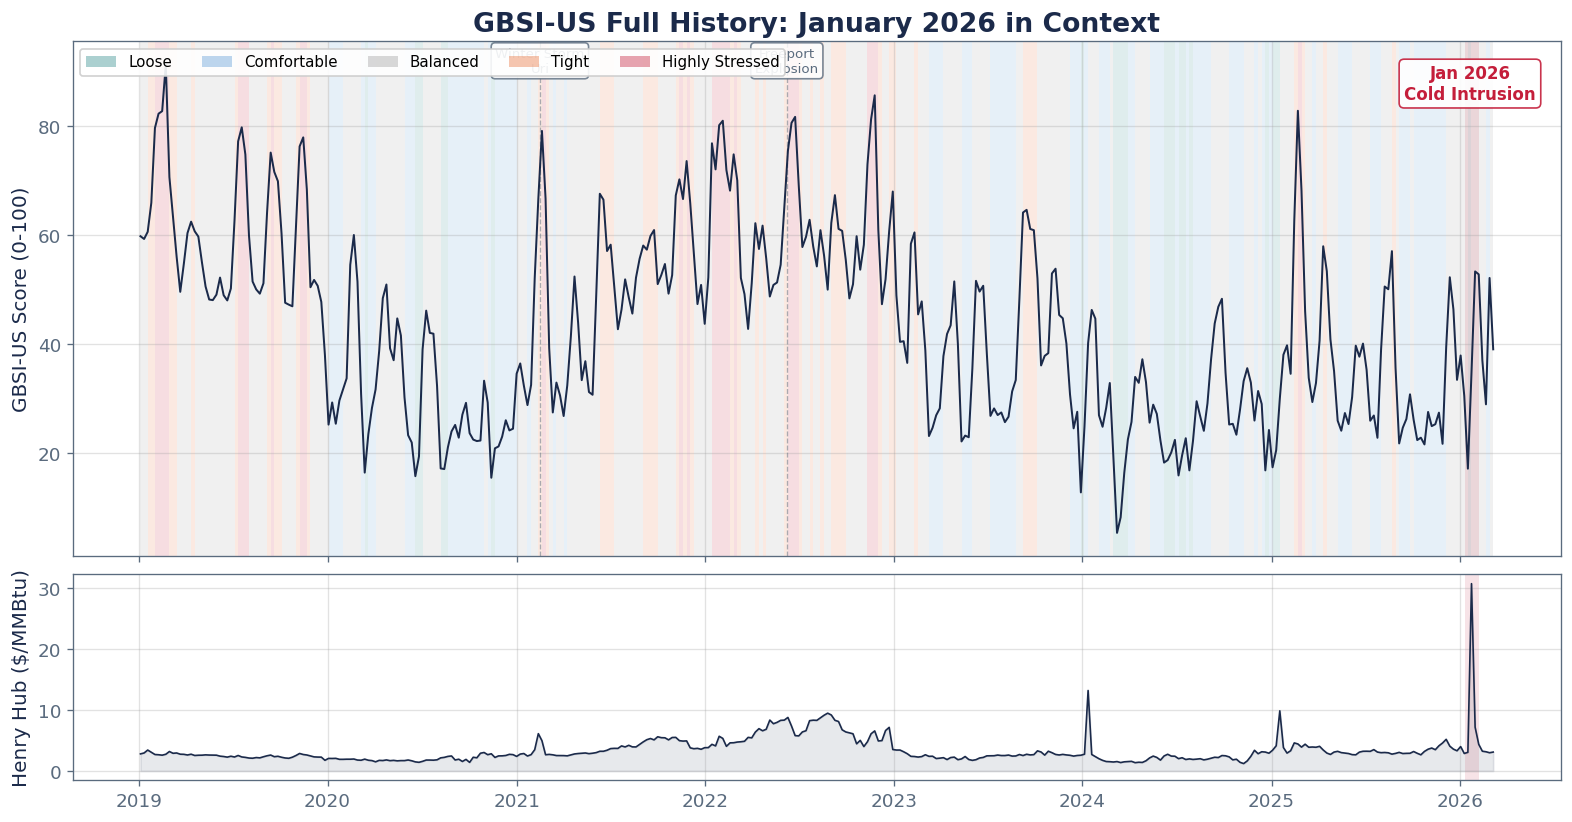
Beyond the single case study: across the full GBSI history (2019-present), what happens to Henry Hub prices when the system enters stress?
January 2026 entered BALANCED then moved toward TIGHT, exactly the regime states where both median vol and tail risk are elevated above unconditional levels.
| Signal | n | Median |Ret| 4W | Vol Multiplier | Tail Lift |
|---|---|---|---|---|
| Direction: TIGHTENING | 134 | 14.5% | 1.13x | 1.04x |
| Direction: STABLE | 95 | 12.4% | 0.96x | 1.05x |
| Direction: LOOSENING | 142 | 11.8% | 0.91x | 0.92x |
| Regime: LOOSE | 21 | 10.6% | 0.82x | 0.48x |
| Regime: COMFORTABLE | 91 | 12.2% | 0.95x | 0.99x |
| Regime: BALANCED | 185 | 12.9% | 1.00x | 1.19x |
| Regime: TIGHT | 48 | 14.0% | 1.08x | 0.62x |
| Regime: HIGHLY_STRESSED | 26 | 14.7% | 1.14x | 0.77x |
Full GBSI history with the January 2026 event highlighted in context. Shows this was not a one-off. The regime framework captures stress episodes consistently.
The WRSI-to-WSSI-to-GBSI cascade historically provides one to two weeks of lead time before Henry Hub price dislocations.
When WRSI enters TRANSITION regime with elevated COLD tail alerts, this signal combination typically precedes:
The model disagreement pattern adds a confirmation layer. Persistent forecast disagreement followed by rapid convergence historically marks the transition from uncertainty to consensus, providing a timing signal for position sizing.
The January 2026 cold intrusion drove Henry Hub from $3.06 to $30.72 in a single week. Snowtrail's three-product cascade detected the build-up 13 days before the price spike, with each product confirming a different stage of the transmission mechanism.
US Gas Trader: - WRSI TRANSITION + elevated COLD alerts = demand risk building. Pre-position before the storage report confirms the draw - WSSI-US EXTREME_VOLATILITY = storage demand shock quantified. Size the trade based on the implied draw magnitude - GBSI-US regime shift to BALANCED or higher = forward price risk elevated. The cascade is confirmed
Risk Manager: - Vol multiplier and tail lift from the GBSI backtest are direct inputs to regime-conditional VaR - Model disagreement scores provide an additional uncertainty measure for scenario analysis - The cascade timeline is a stress-test template: when all three products escalate in sequence, standard risk models underestimate the compounding effect
The 10x Henry Hub spike was not a surprise to the signals. WRSI flagged it 13 days early, WSSI-US confirmed it 4 days early, and GBSI-US captured the balance stress in real time. The cascade gives traders a structured framework for positioning ahead of weather-driven price dislocations.
Request a demo to explore US Gas and Weather Intelligence signals with your own use cases.
Request Demo